XRP Steadies but Is below the Peak of $0.60
Estimated Reading Time: 2 minutes
Don’t invest unless you’re prepared to lose all the money you invest. This is a high-risk investment and you are unlikely to be protected if something goes wrong. Take 2 minutes to learn more
XRP (XRP) Long-Term Analysis: Bullish
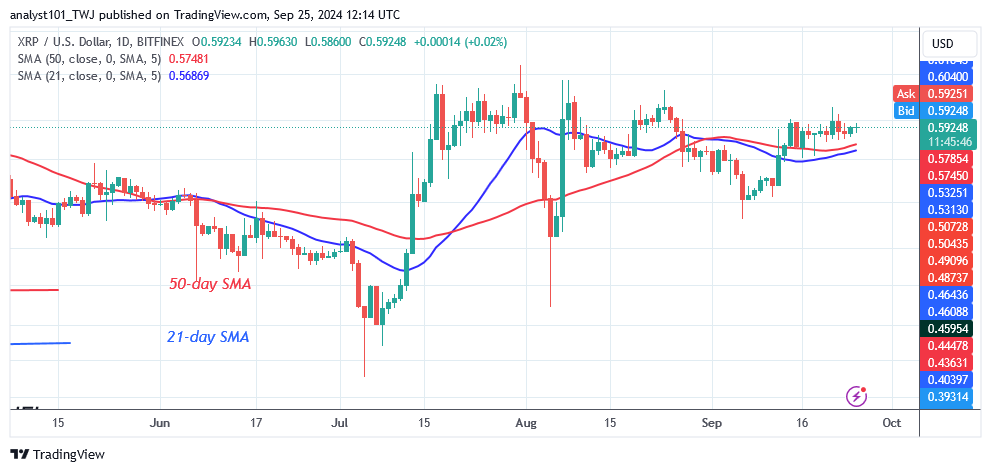
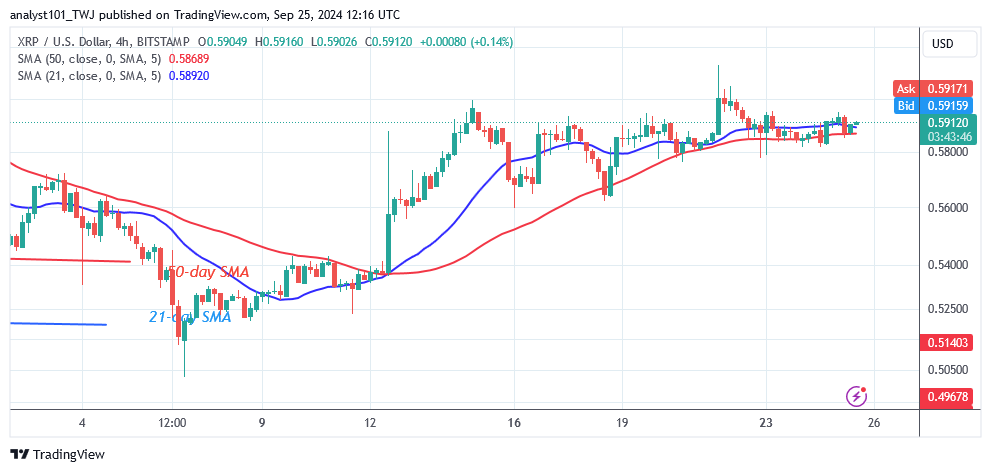
The price of XRP (XRP) has been steady above the moving average lines or the $0.57 support but is below the peak of $0.60. However, the price movement has been static due to the creation of Doji candlesticks. Doji candlesticks represent traders’ seeming indifference to market direction. On the upside, buyers have failed to sustain the price above the resistance level of $0.60.
However, if the bulls break the current barrier, XRP will rise to the next resistance level, $0.64.The upward movement has been hampered by the $0.60 resistance. The cryptocurrency trades in a tight range above the moving average lines but below the resistance level of $0.60. XRP is currently worth $0.59 at the time of writing.
Technical Indicators:
Major Resistance Levels – $1.00, $1.50, $2.00
Major Support Levels – $0.50, $0.30, $0.10
XRP (XRP) Indicator Analysis
The price bars are consolidating above the horizontal moving average lines. The price bars are above the moving average lines but the upward move is stuck at the $0.60 high. The price action is denominated by Doji candlesticks which cause the price to remain stagnant.
What Is the Next Direction for XRP (XRP)?
XRP is in a sideways trend and a tight range but is below the peak of $0.60. Presently, the altcoin is fluctuating above the $0.56 support but below the $0.60 price level. The price movement has remained stagnant due to the dominance of the Doji candlesticks. The crypto’s price is range bound as the crypto signal trades in a tight range.
You can purchase crypto coins here. Buy LBLOCK
Note: Cryptosignals.org is not a financial advisor. Do your research before investing your funds in any financial asset or presented product or event. We are not responsible for your investing results.