Chainlink (LINK/USDT) Consolidates Near $18.89
Estimated Reading Time: 3 minutes
Don’t invest unless you’re prepared to lose all the money you invest. This is a high-risk investment and you are unlikely to be protected if something goes wrong. Take 2 minutes to learn more

Chainlink Long-term Analysis: Ranging
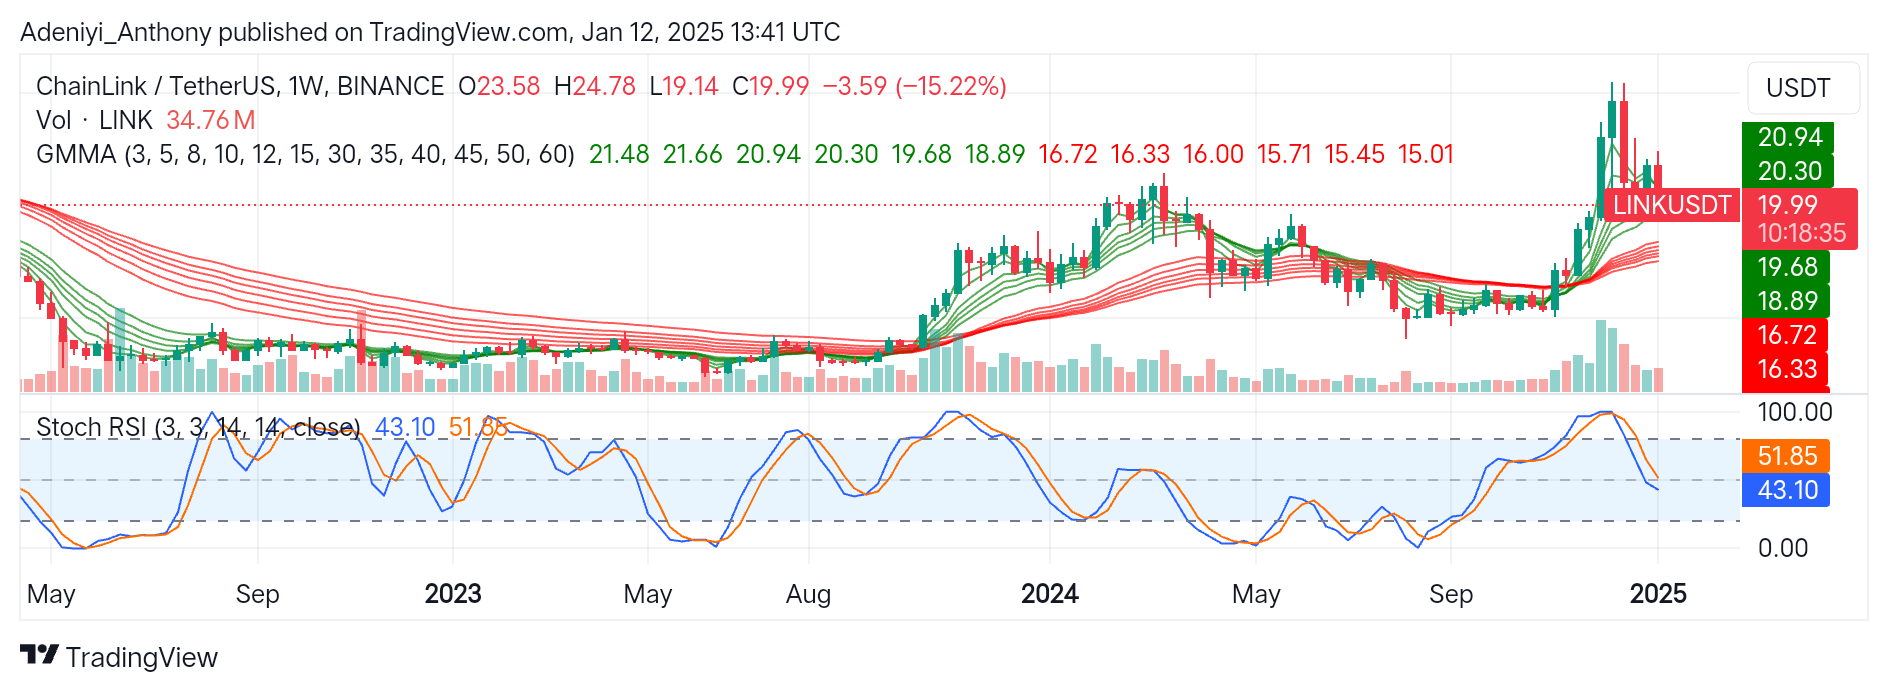
After hitting $24.78, Chainlink against the Tether has experienced significant volatility in recent weeks. However, the pair appears to have pulled back, as seen in the $15.22 price dip.
The indicators on the chart show the pair is acting under selling pressure. However, the price positioning around the Guppy Multiple Moving Averages (GMMAs) suggests Chainlink traders can re-enter the market, but the Stochastic RSI still operates in the neutral zone.
Currently, Chainlink trades at $19.99 with over 34 million weekly traded volumes.
Technical Indicators
Major Resistance Levels: $20.94, $22.00, and $24.78
Major Support Levels: $18.89, $16.72, and $15.00
Chainlink Technical Analysis
On the weekly timeframe, Chainlink against the Tether appears to range close to $18.89 after experiencing a sharp dip. However, as the market remains cautious, indicators on the chart point to weakness in the current decline; a decisive move above $21.00 could indicate renewed bullishness. Moreover, if the price dips below $18.89, the $16.72 may be the next support level to watch out for.
Additionally, the positioning of the Stochastic lines signals the price is consolidating before making a decisive move. This can be seen in the slight convergence of the lines, indicating a recovery might be on the horizon. However, further deepening of the lines could hint at continued bearish pressure.
LINK/USDT Analysis: Expectations
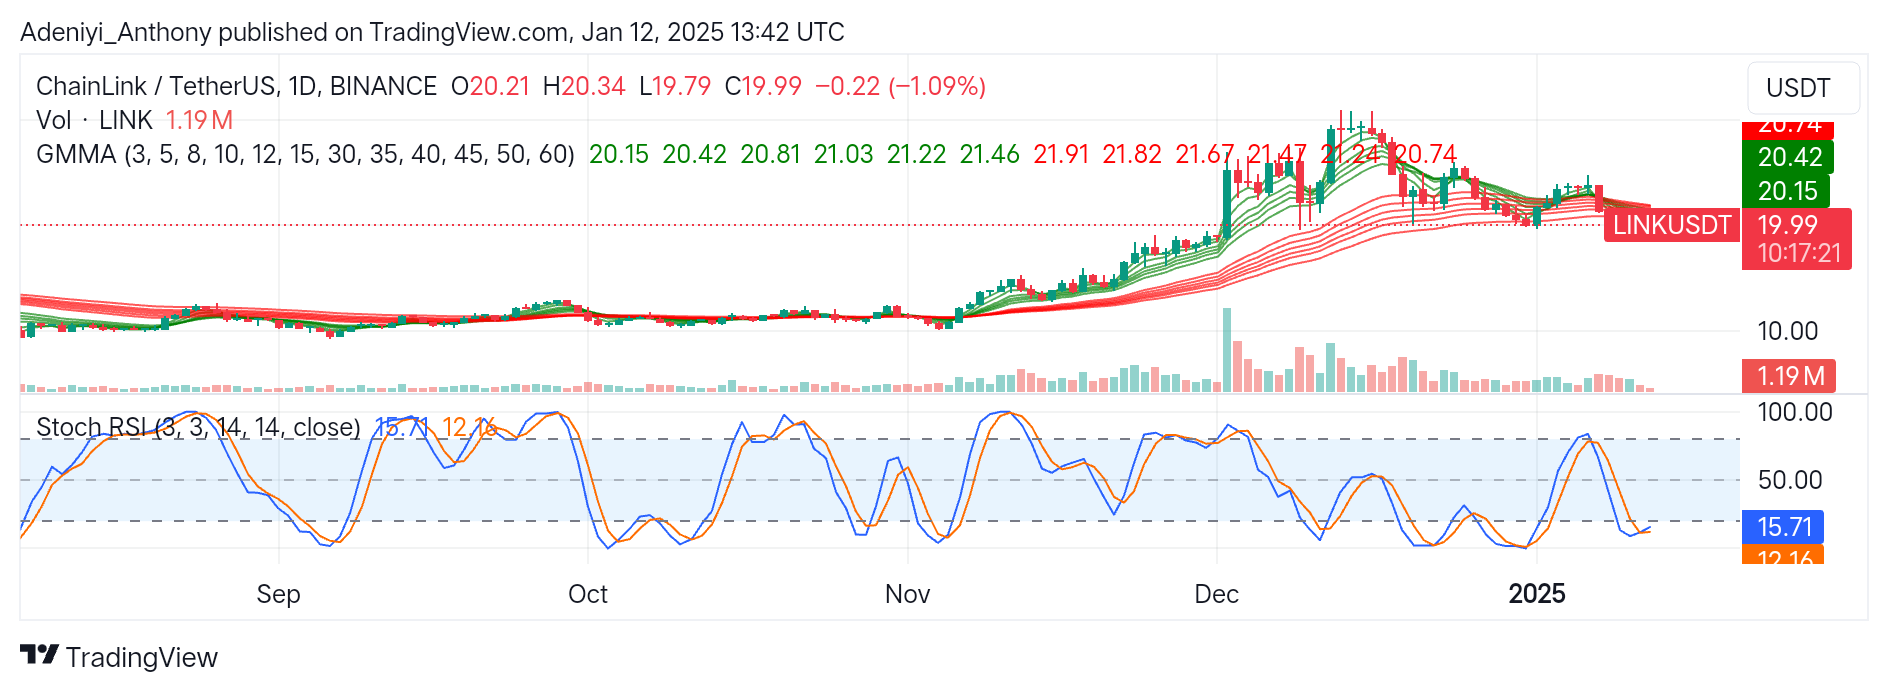
On the daily timeframe, LINK/USDT is down by 1.09%, signaling continued bearish momentum. However, the convergence of the GMMAs shows the market lacks direction with reduced long-term bullish momentum as the long-term EMAs flatten out.
On the other hand, the Stochastic RSI indicates an oversold condition for the pair. However, the appearance of the lines below the 20-mark level suggests the current trend may be waning and price may bounce to the North if bullish traders step in.
To this end, as the volume increases, a break above $20.15 would confirm the recovery; otherwise, a break below the current level indicates the continuation of price deepening.
You can purchase crypto coins here. Buy LBlock