
Free Crypto Signals Channel
Lucky Block Price Prediction – September 8
 Most Popular
- 2-5 Signals Daily
- 82% Success Rate
- Entry, Take Profit & Stop Loss
- Amount To Risk Per Trade
- Risk Reward Ratio
The Lucky Block price prediction shows that LBLOCK may continue to move sideways under the 9-day moving average before shooting to the upside.
LBLOCK/USD Medium-term Trend: Ranging (1D Chart)
Key Levels:
Resistance levels: $0.0020, $0.0022, $0.0024
Support levels: $0.0003, $0.0002, $0.0001
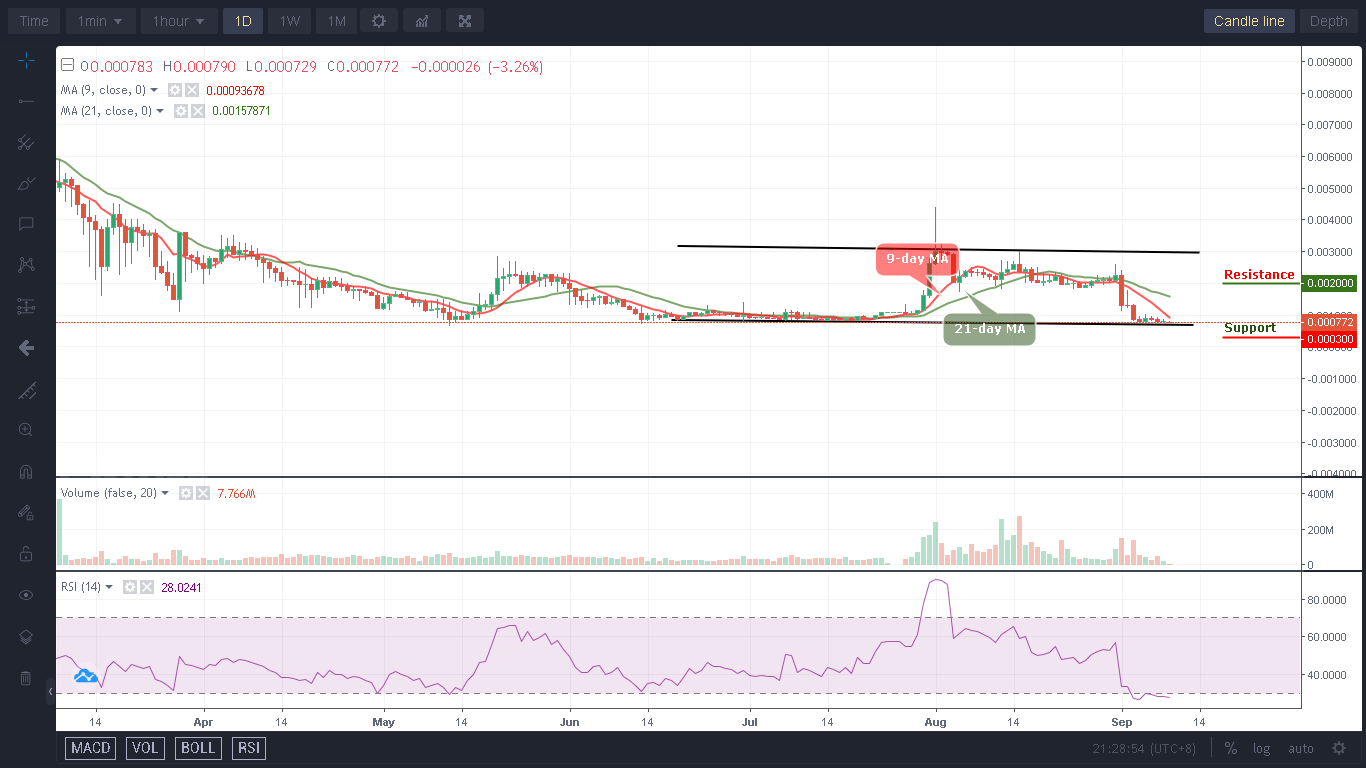
LBLOCK/USD is ranging below the 9-day and 21-day moving averages. The market price is therefore getting ready to shoot to the upside, traders are anticipating that the current price movement is an indication of the upcoming price rally in the market.
Lucky Block Price Prediction: LBLOCK/USD Will Go Bullish
According to the daily chart, the next step for the Lucky Block price is to reclaim back the resistance level of $0.0010; once this is done, bulls will cross above the moving averages to face the resistance levels of $0.0020, $0.0022, and $0.0024. However, as the technical indicator Relative Strength Index (14) moves within the oversold region, meanwhile, if the coin retreats a little bit to the south, the support levels of $0.0003, $0.0002, and $0.0001 may be visited and it will be the best opportunity for the new investors to come into the market.
LBLOCK/USD Medium-term Trend: Bearish (4H Chart)
On the 4-hour chart, the Lucky Block price is sliding below the 9-day and 21-day moving averages, and it is likely to head to the lower boundary of the channel. The technical indicator Relative Strength Index (14) is moving into the oversold region before heading to the north.

However, if the bulls push the price above the moving averages, the Lucky Block would rise to the resistance level of $0.0017 and above but this might not come to play if the 9-day MA crosses below the 21-day MA. However, this could bring the price towards the lower boundary of the channel, and staying there may cause the coin to reach the support level of $0.0003 and below while new buyers are expected to come into the market.
You can purchase Lucky Block here. Buy LBLOCK