Can Lucky Block (LBLOCK) Reach New Highs? Key Indicators Suggest a Potential Upside
Estimated Reading Time: 2 minutes
Don’t invest unless you’re prepared to lose all the money you invest. This is a high-risk investment and you are unlikely to be protected if something goes wrong. Take 2 minutes to learn more

Lucky Block (LBLOCK) has been displaying steady momentum in recent trading sessions, staying within a narrow price range. With growing interest in the market, the token may be on the verge of a breakout. Let’s delve into the daily and 4-hour charts to assess where LBLOCK might be headed next.
Daily Chart Analysis: Steady Growth with Upside Potential
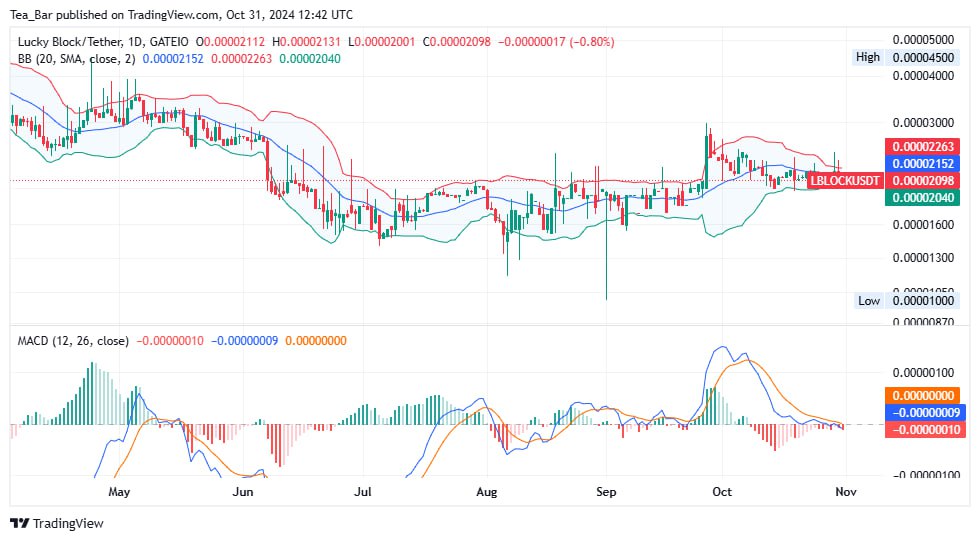
On the daily chart, LBLOCK is trading between the 20-day and 50-day Bollinger Bands, currently priced around $0.00002098. This position near the middle Bollinger band indicates a balanced market, with resistance at the upper band around $0.00002263. A break above this resistance could signal the start of a bullish trend, with potential targets around $0.00002400 and beyond.
The MACD on this timeframe shows a mild bearish crossover, but with low trading volume, any downside pressure may be limited. If buyers regain momentum, LBLOCK might break out of its current range, aiming for new highs.
Lucky Block in Focus: Bullish Sentiment Brewing
On the 4-hour chart, LBLOCK is positioned for a potential breakout, trading close to the upper Bollinger Band at $0.00002274. Strong support at the lower Bollinger Band around $0.00002011 provides a stable foundation.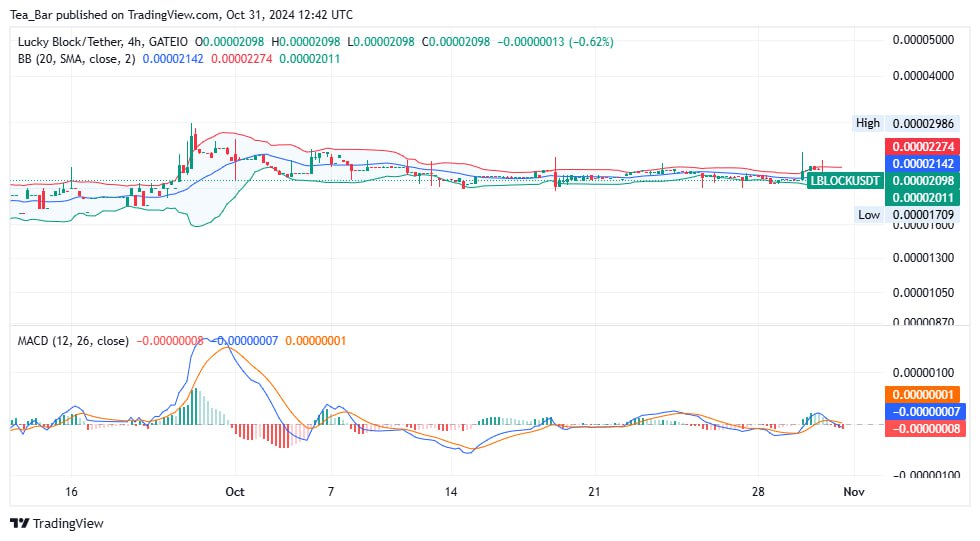
The MACD is approaching a crossover point on this chart, with the MACD and signal lines aligned around zero. This setup hints at a possible shift in momentum favoring the bulls, especially if LBLOCK breaks above the $0.00002274 resistance. A successful breakout here could trigger a rally, pushing LBLOCK toward higher targets, potentially around $0.00002400.
Conclusion
The technical setup for LBLOCK suggests an optimistic outlook, as it consolidates within a range that could easily shift bullish with the right momentum. A breakout above $0.00002263 on the daily chart or $0.00002274 on the 4-hour chart could set LBLOCK on a path toward $0.00002400 and beyond, making these levels important for traders watching LBLOCK’s next potential move.
You can purchase Lucky Block here. Buy LBLOCK.