Lucky Block on the Verge of a Breakout: Momentum Builds as Key Levels Near
Estimated Reading Time: 3 minutes
Don’t invest unless you’re prepared to lose all the money you invest. This is a high-risk investment and you are unlikely to be protected if something goes wrong. Take 2 minutes to learn more

Lucky Block (LBLOCK) is experiencing a consolidation phase, and both the 4-hour and daily charts reveal signals of an impending bullish movement. As technical indicators align, traders are looking closely at key levels for potential breakouts.
Daily Chart Analysis: Signs of Accumulation and Strengthening Bullish Indicators
On the daily chart, Lucky Block (LBLOCK) continues to trade within the Keltner Channels, with a key support level at $0.00001765 and strong resistance near $0.00002632. The price is currently hovering at $0.00002187, which suggests consolidation after testing recent highs. The MACD is showing bullish momentum, with the lines above the zero level and the histogram beginning to turn positive, signaling potential upward movement.
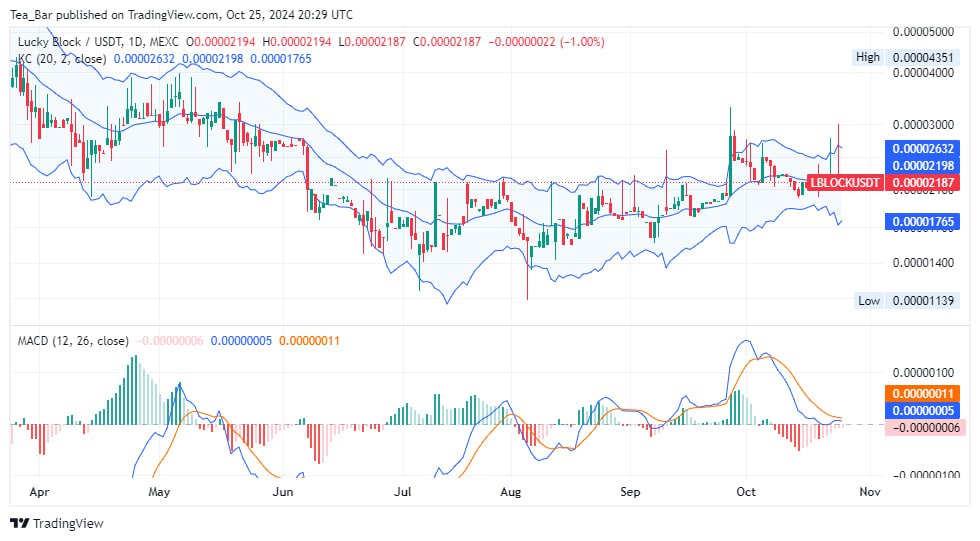
If LBLOCK can break through the $0.00002632 resistance level, the next target will be $0.00004351, representing a significant move upward. However, if the price fails to hold above current levels, a retest of the $0.00001765 support could occur, presenting a buying opportunity for longer-term investors.
4-Hour Chart Analysis: Consolidation Within a Narrow Range
The 4-hour chart for Lucky Block (LBLOCK) shows a period of consolidation within the Keltner Channels, as the price fluctuates around $0.00002187. Resistance is currently observed at $0.00002395, while immediate support lies at $0.00001977. The tightening of the Keltner Channels indicates a potential for increased volatility in the near future, possibly leading to a breakout.
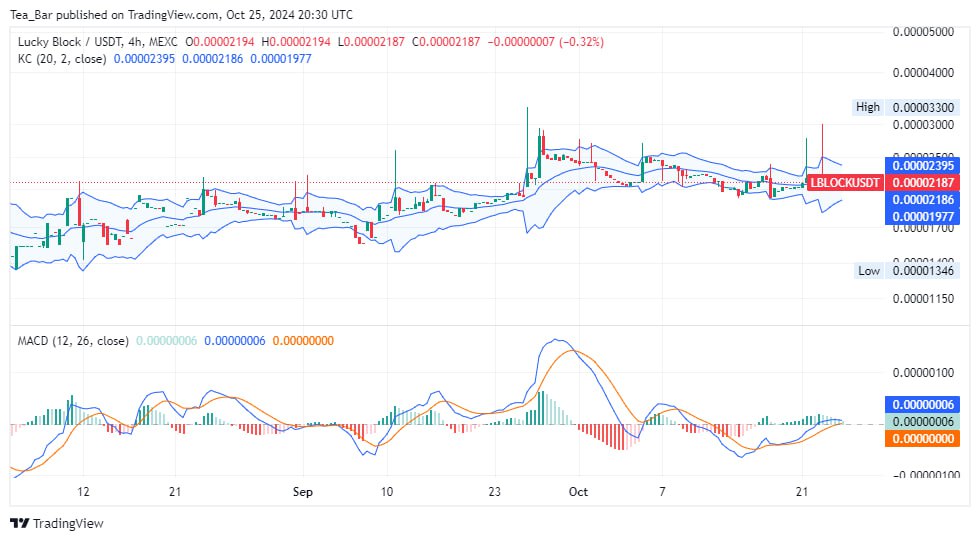
The MACD indicator is nearing a bullish crossover, with the histogram showing a weakening bearish momentum. If the current trend persists, Lucky Block could push towards $0.00002395 and beyond, testing the higher resistance levels. Traders should watch for a sustained close above this resistance as confirmation of a bullish reversal.
Glimpse Into the Future: A Promising Outlook for Lucky Block
With the technical indicators showing signs of a possible breakout, Lucky Block may be on the cusp of a significant upward move. If resistance levels are successfully breached, the token could gain traction, pushing toward higher highs. As volatility returns to the market, traders will be keenly watching for a confirmed breakout in the coming sessions.
You can purchase Lucky Block here. Buy LBLOCK.