Lucky Block (LBLOCK): Eyeing a Technical Breakout
Estimated Reading Time: 3 minutes
Don’t invest unless you’re prepared to lose all the money you invest. This is a high-risk investment and you are unlikely to be protected if something goes wrong. Take 2 minutes to learn more

Lucky Block (LBLOCK) is trading at $0.00003145, showing steady price action despite broader market hesitation. Its consolidation near key support zones and signs of momentum recovery suggest that a breakout may be forming. Could LBLOCK be gearing up for its next strong upward move?
Coffee-Strong Daily Structure and Bollinger Compression
On the daily chart, LBLOCK is holding firm above $0.00002818, which has acted as a critical support level multiple times. Price is consolidating between the lower and mid-Bollinger Bands, hinting at reduced volatility and coiling for a potential expansion phase. A close above the mid-band near $0.00003297 could set the stage for a push toward the upper band at $0.00003775.
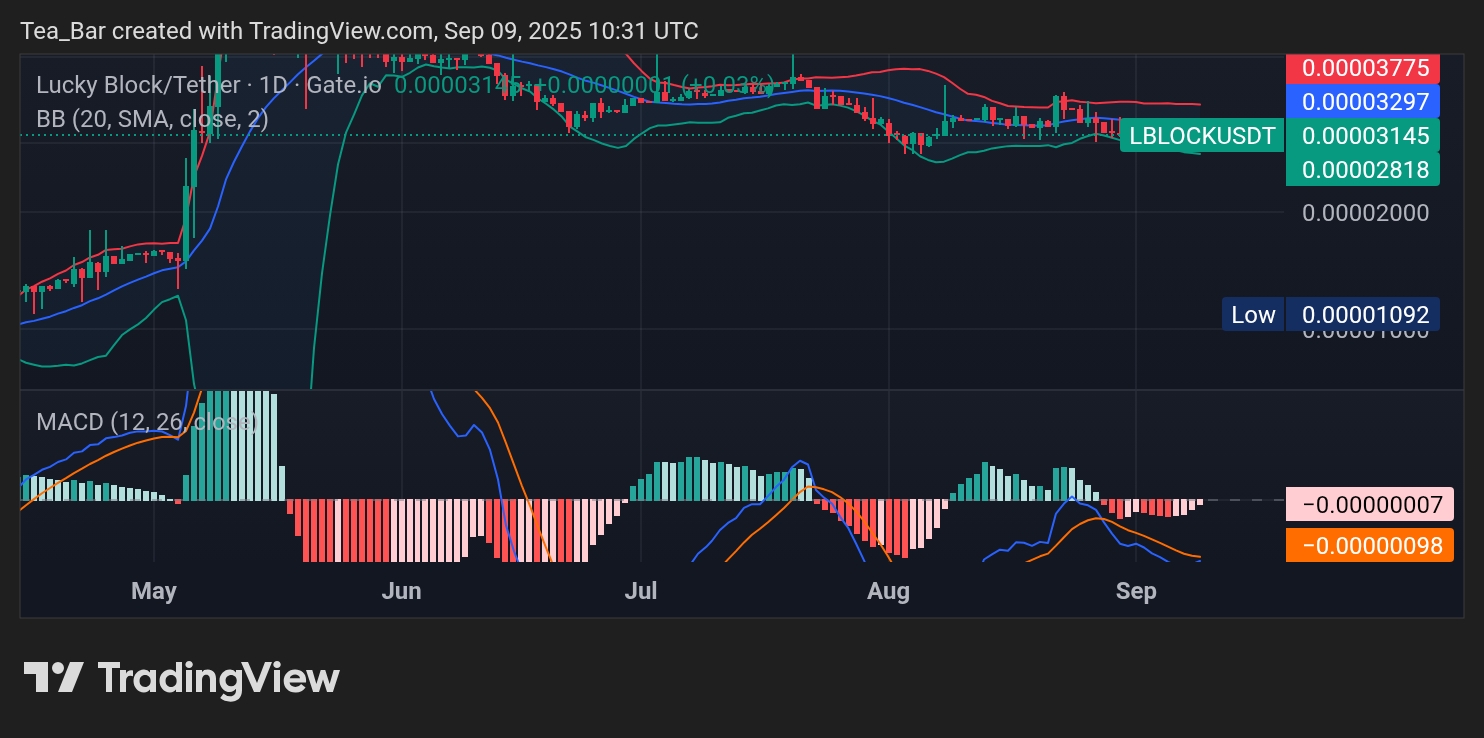
The MACD is currently hovering just below the zero line, showing a flattening histogram that may signal weakening bearish momentum. If the MACD line crosses above the signal line, it could act as an early bullish trigger and attract fresh buying pressure.
4H Chart: Momentum Turning in Bulls’ Favor
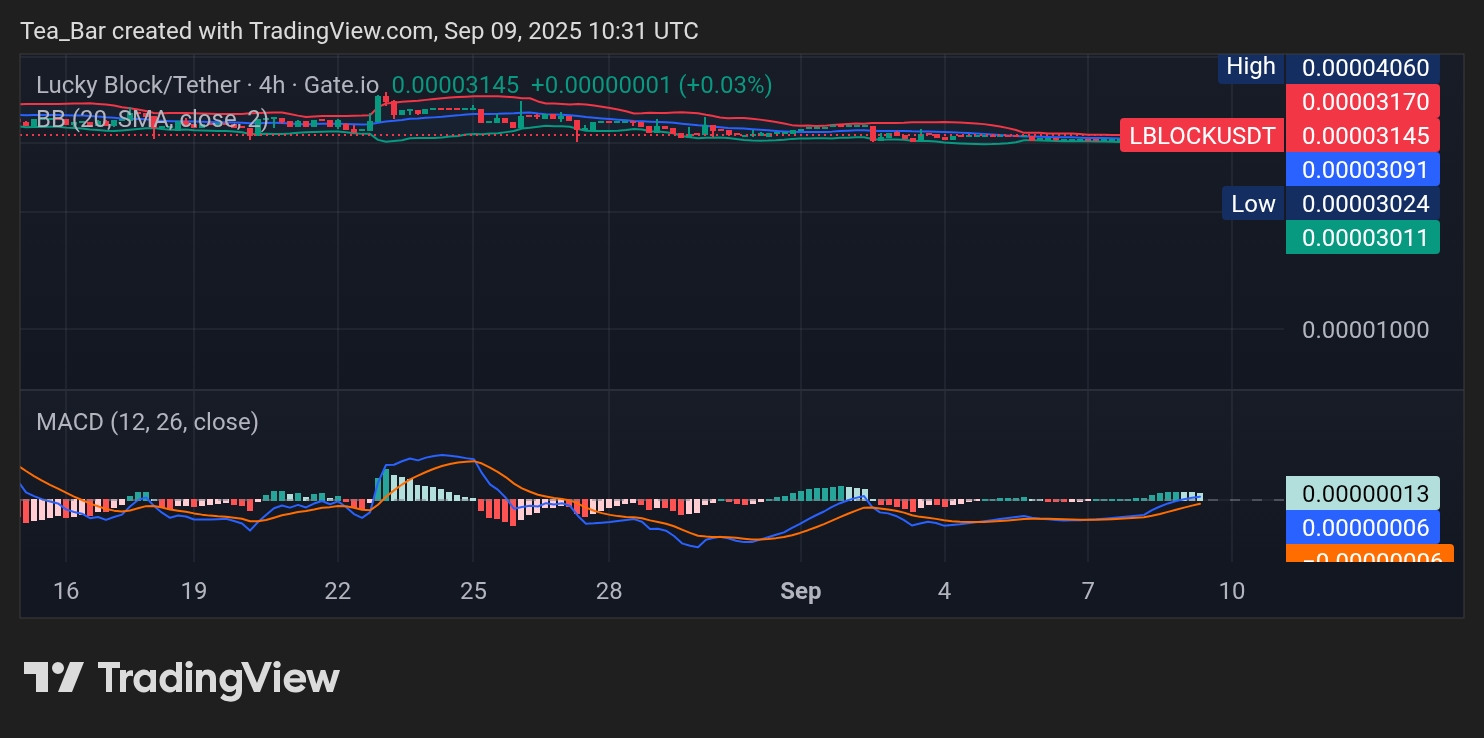
The 4-hour chart provides a closer look at this setup, with price consolidating tightly around $0.00003145. The Bollinger Bands are narrowing, another sign of price compression before a potential breakout. Key support lies at $0.00003024, with resistance nearby at $0.00003170 and $0.00003297.
Importantly, the MACD histogram is shifting toward green, and the MACD line is approaching a bullish crossover with the signal line. This development may hint at short-term bullish momentum that could propel LBLOCK toward higher targets if confirmed.
LBLOCK’s Next Big Move Could Be Imminent
Lucky Block’s technical picture shows a market in balance but ready to tip toward buyers if resistance levels are cleared. The combination of Bollinger Band compression and an improving MACD setup makes this an important juncture for traders and investors alike.
A decisive close above $0.00003297 could open the door to a run toward $0.00003775, while failure to hold $0.00003024 might see a retest of lower support zones. With volatility likely to return soon, LBLOCK is setting up for a potentially explosive move.
Invest wisely, and let Lucky Block’s potential work in your favor. You can purchase Lucky Block here. Buy LBLOCK.