Lucky Block (LBLOCK): Preparing for Its Next Big Move
Estimated Reading Time: 3 minutes
Don’t invest unless you’re prepared to lose all the money you invest. This is a high-risk investment and you are unlikely to be protected if something goes wrong. Take 2 minutes to learn more

Lucky Block (LBLOCK) is holding steady despite broader market uncertainty, continuing to draw interest from crypto-gaming enthusiasts and investors alike. Its current consolidation near a critical support level hints at growing accumulation and a possible bullish breakout. Could this be the quiet before the storm for LBLOCK?
Coffee-Strong Daily Support and Sideways Calm
On the daily chart, LBLOCK is trading at $0.00003127, hugging the lower band of the Bollinger Bands (20, 2). This suggests price compression and a likely build-up for volatility expansion. The key support sits near $0.00002923, which has been consistently defended — a sign that buyers are active and absorbing selling pressure.
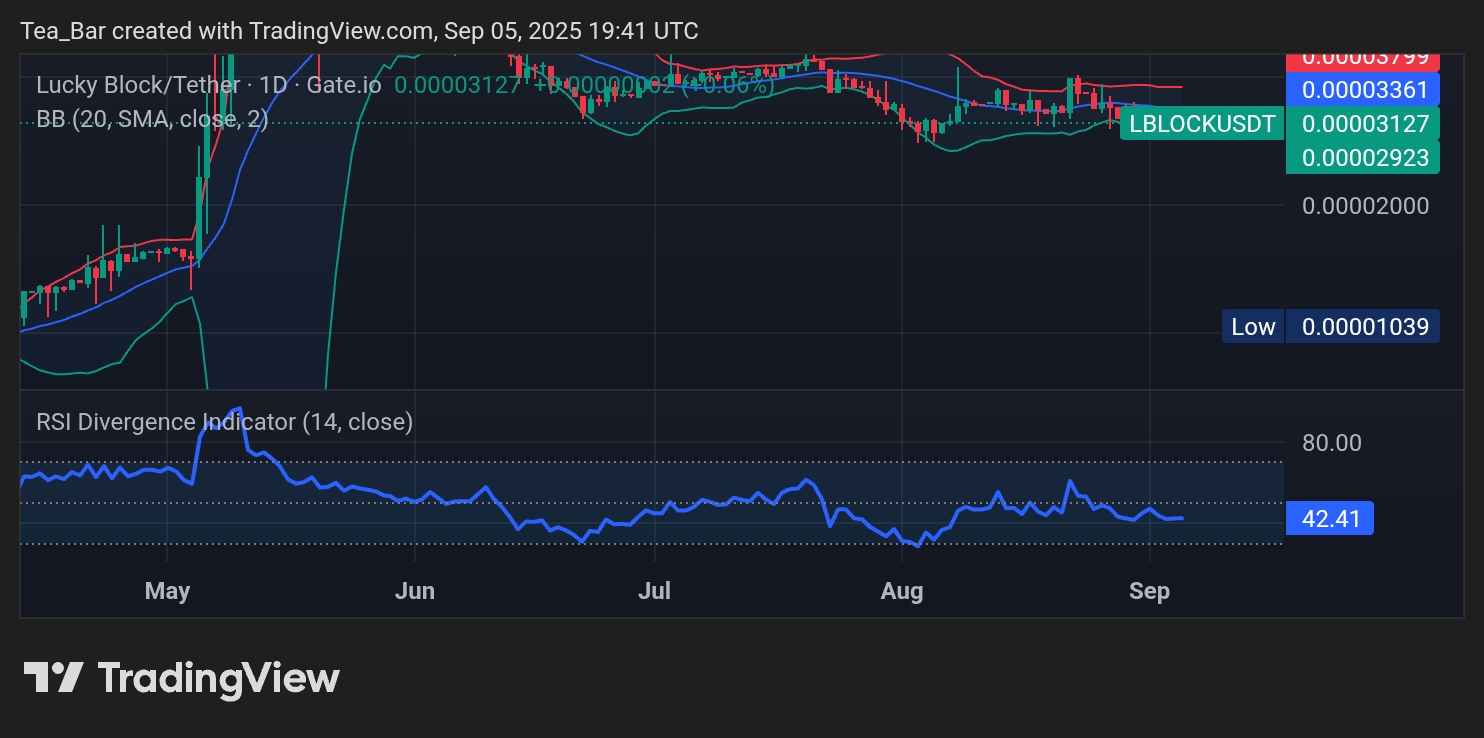
The RSI at 42.41 reflects slightly oversold conditions, historically signaling a reversal zone. If LBLOCK pushes above the mid-band of the Bollinger Channel (around $0.00003361), it could open a path toward the upper band near $0.00003799. This setup highlights a period of accumulation that may fuel the next upward surge.
4H Chart: Momentum Reawakening
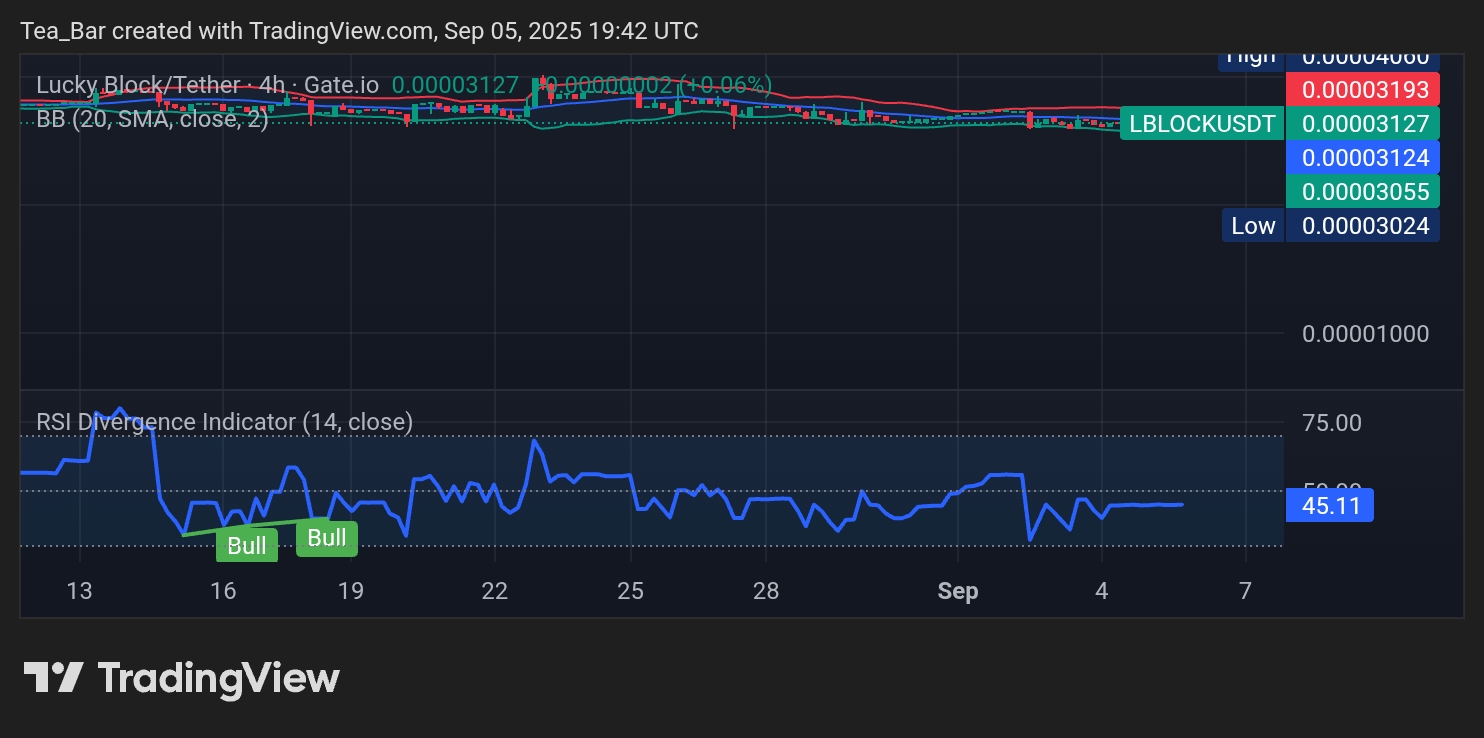
Zooming into the 4-hour chart, LBLOCK continues to trade in a tight range, with price anchored around $0.00003127. The RSI at 45.11 indicates a neutral stance but is gradually trending higher — a subtle hint of momentum recovery.
Key support remains at $0.00003024, and bulls will want to see a break above $0.00003193 to confirm the start of an upward leg. Such a breakout could push price toward $0.00003324 and beyond, creating a clean risk-to-reward scenario for traders watching for an upside move.
LBLOCK’s Next Step Could Be Explosive
Lucky Block’s current market structure shows stability and accumulation — two key ingredients for a breakout. The compression on the Bollinger Bands and steady RSI suggest that volatility could soon return, favoring a bullish resolution if support continues to hold.
For traders and long-term holders, these levels offer a compelling watch zone. A confirmed break above the immediate resistance could spark a rapid move higher, reaffirming LBLOCK’s reputation as one of the most exciting projects in the crypto-gaming sector.
Invest wisely, and let Lucky Block’s potential work in your favor. You can purchase Lucky Block here. Buy LBLOCK.