$SPONGE (SPONGE/USD) Pullback Below $0.000038, Could Ignite Bullish Run
Estimated Reading Time: 3 minutes
Don’t invest unless you’re prepared to lose all the money you invest. This is a high-risk investment and you are unlikely to be protected if something goes wrong. Take 2 minutes to learn more

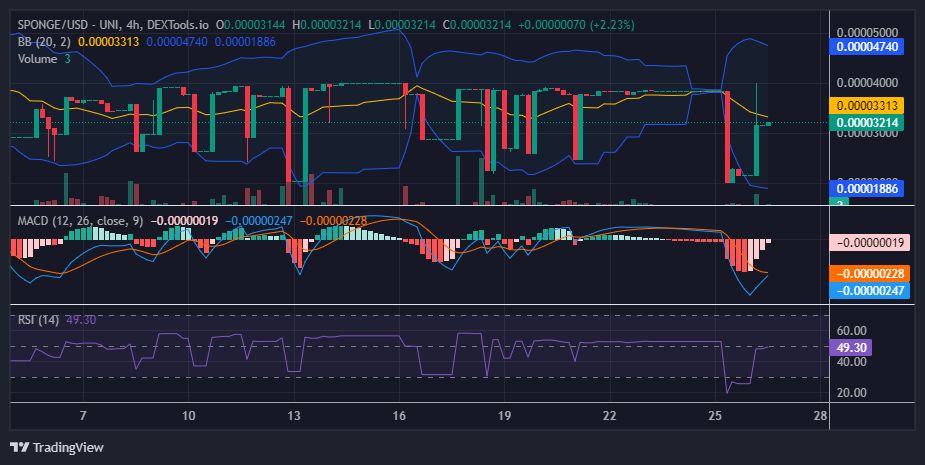
Following a period of price stability near the $0.000038 mark, the SPONGE/USD market experienced a sharp downturn, finding strong support at the $0.00002 level, which facilitated a subsequent upward bounce. The bullish momentum carried the price as high as $0.00004 before a new resistance level appeared to form at $0.000032. The emergence of this resistance level, which is lower than the previous $0.000038 level, may suggest that the bears are gaining the upper hand. However, indicators, particularly the MACD, are signaling a potential recovery.
Key Market Dynamics:
- Resistance Levels: $0.0010, $0.0011, $0.0012
- Support Levels: $0.000026, $0.000025, $0.000024

$SPONGE (SPONGE/USD) Technical Outlook
Previous bearish price activity has triggered downside volatility in the market, causing the Bollinger Bands to diverge and create a wide bandwidth. In recent trading sessions, aggressive bearish activity has escalated market volatility. This crypto signal increased volatility presents an opportunity for the bulls to continue rallying the market toward the $0.00004 price threshold. The price standstill at $0.000032 has persisted for only two or three 4-hour trading sessions, which is not long enough to establish this level as a stable point. Therefore, the price action may soon break out from this level and rally back to around $0.000038.
The Moving Average Convergence and Divergence (MACD) indicator shows signs of a potential breakout, as the previously red histograms have transitioned to pale red, with their heights decreasing rapidly. This suggests an underlying tendency for a breakout. Additionally, the Relative Strength Index (RSI) indicates that the price action is currently moving around the midpoint of the indicator.
$SPONGE (SPONGE/USD) 1-Hour Chart Insights
A closer examination of the 1-hour chart reveals a significant price drop that pushed the market into oversold territory. However, a sharp subsequent recovery targeting the $0.00004 level has now temporarily stabilized near the $0.000032 resistance. The market has been fluctuating between the $0.00004 and $0.000035 levels, with price support found around the $0.000031 mark. This support level could potentially serve as a foundation for a rebound.
Buy $SPONGE!
Say it back 💦🧽 pic.twitter.com/SiN8JYqB96
— $SPONGE (@spongeoneth) August 27, 2024
Join the SPONGE community and be part of the next big crypto sensation! Buy Sponge ($SPONGE) today!