Lucky Block (LBLOCK): The Final Washout Before a Monumental Reversal
Estimated Reading Time: 3 minutes
Don’t invest unless you’re prepared to lose all the money you invest. This is a high-risk investment and you are unlikely to be protected if something goes wrong. Take 2 minutes to learn more

Lucky Block (LBLOCK) is undergoing a period of intense market cleansing, a phase often witnessed before a significant trend reversal. The current price action, while challenging, is forming what technical analysts recognize as a potential capitulation low. This period of consolidation at a deep historical level is where sustainable rallies are born, offering a strategic window of opportunity.
Daily Chart Analysis: Forming a Historic Base
The daily chart reveals that LBLOCK is engaging with a profoundly significant support zone. The Parabolic SAR indicator, while currently aligned with the downtrend, shows the price trading at a substantial distance from its dots. This extreme separation can often precede a momentum shift. Most notably, the MACD, though deep in negative territory, shows a notable slowing in its downward trajectory on the histogram.
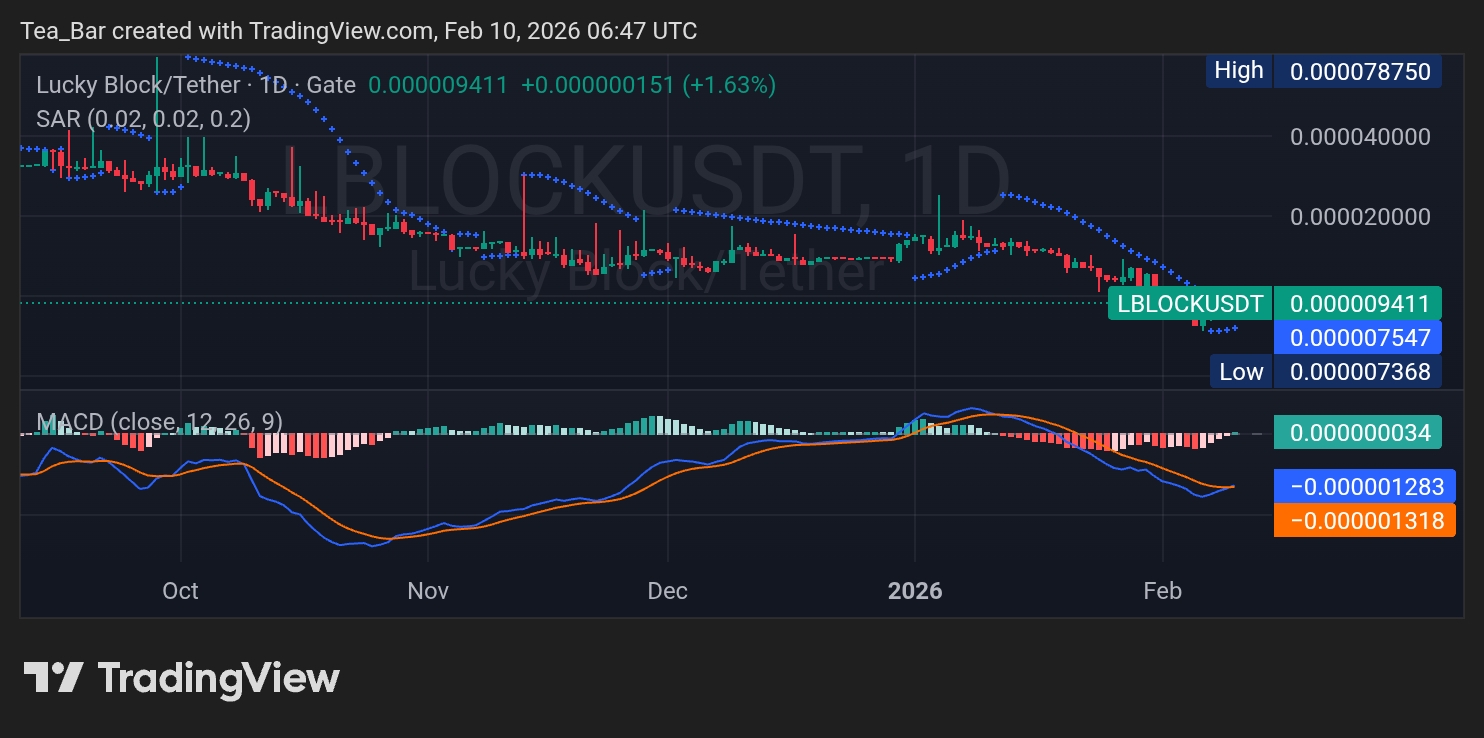
This deceleration in bearish momentum is the first critical step toward a potential reversal, suggesting the selling pressure is exhausting itself at this level. The token has established a critical foundational support at 0.000007368. The subsequent support level to monitor is 0.00000500. For any recovery, the initial resistance hurdles will be 0.000009411 and 0.000015050.
4H Chart Analysis: Momentum Stabilizes at an Extreme
The 4-hour chart shows the price action stabilizing after a pronounced decline, entering a phase of compression. The Parabolic SAR continues to reflect the short-term trend, but the price is attempting to base. The MACD on this timeframe, while negative, is also exhibiting a clear flattening pattern.
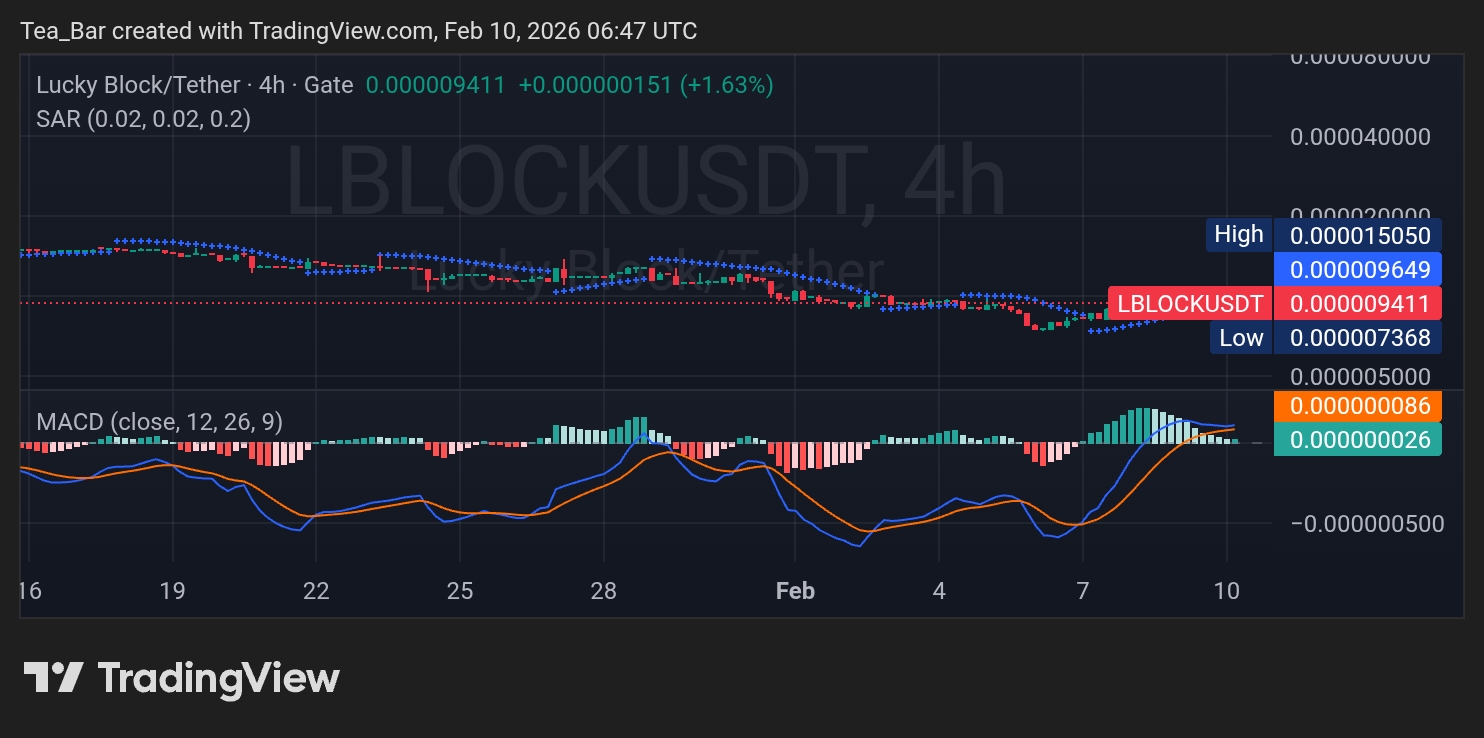
This stabilization in momentum at an extreme low is a classic technical sign that a balance is being found and a floor is being established. Immediate intraday resistance is positioned at 0.000009411. A break above this level would signal the first step in reclaiming bullish territory. The current trading is centered on defending the 0.000007368 support.
Conclusion: Positioning at a Generationally Significant Level
Lucky Block is testing a price level that represents a extreme valuation point. History shows that the most powerful bull markets often ignite from zones of maximum pessimism, where weak hands capitulate and long-term foundations are laid. The current technical picture, characterized by exhausting bearish momentum and price stabilization at deep support, sets the stage for a powerful mean reversion rally. For the strategic investor, this represents a high-conviction accumulation zone before the next major upward cycle.
Invest wisely, and let Lucky Block’s potential work in your favor. You can purchase Lucky Block here. Buy LBLOCK