Lucky Block (LBLOCK): Tight Ranges Signal Breakout Potential
Estimated Reading Time: 3 minutes
Don’t invest unless you’re prepared to lose all the money you invest. This is a high-risk investment and you are unlikely to be protected if something goes wrong. Take 2 minutes to learn more

Lucky Block (LBLOCK) is trading at $0.00003661 as of August 23, 2025, after slipping nearly 8% in the latest session. Despite short-term selling pressure, the broader technical setup across both daily and 4-hour charts suggests price compression is nearing its peak. With Bollinger Bands tightening and the MACD showing signs of recovery, LBLOCK may be preparing for a decisive move.
Daily Chart: Compression Points to Imminent Volatility
On the daily timeframe, LBLOCK has been consolidating within a narrowing range, holding above $0.00002986 while struggling to reclaim $0.00003845 resistance. The Bollinger Bands have contracted sharply, indicating reduced volatility and foreshadowing an eventual expansion. This kind of squeeze often precedes large directional moves, making current levels critical.
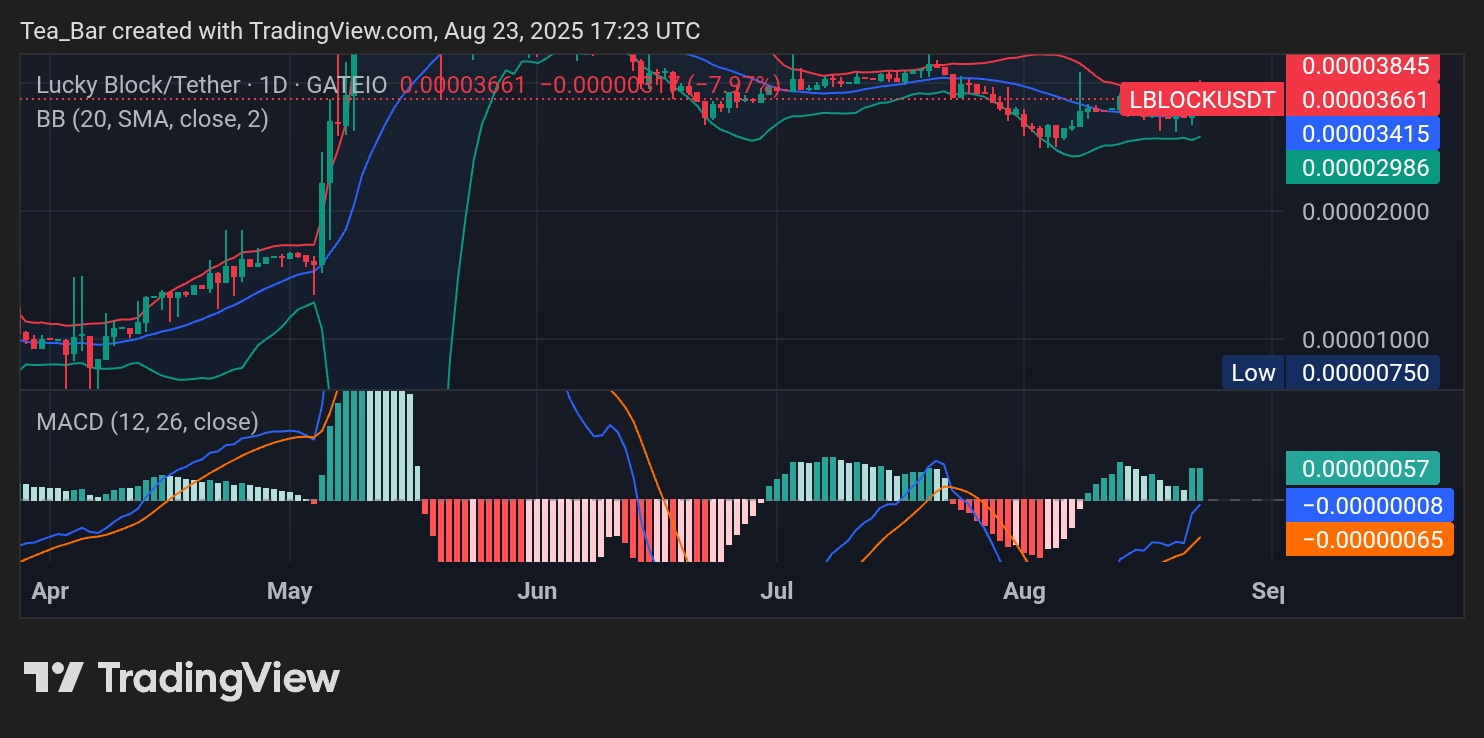
The MACD adds weight to the bullish argument. After weeks of bearish pressure, the histogram has returned to near-neutral while the MACD and signal lines begin to converge. This suggests that downside momentum is fading, and a crossover could mark the start of a shift in trend. If confirmed, a move through $0.00003845 could target the psychological $0.00004000 level and beyond.
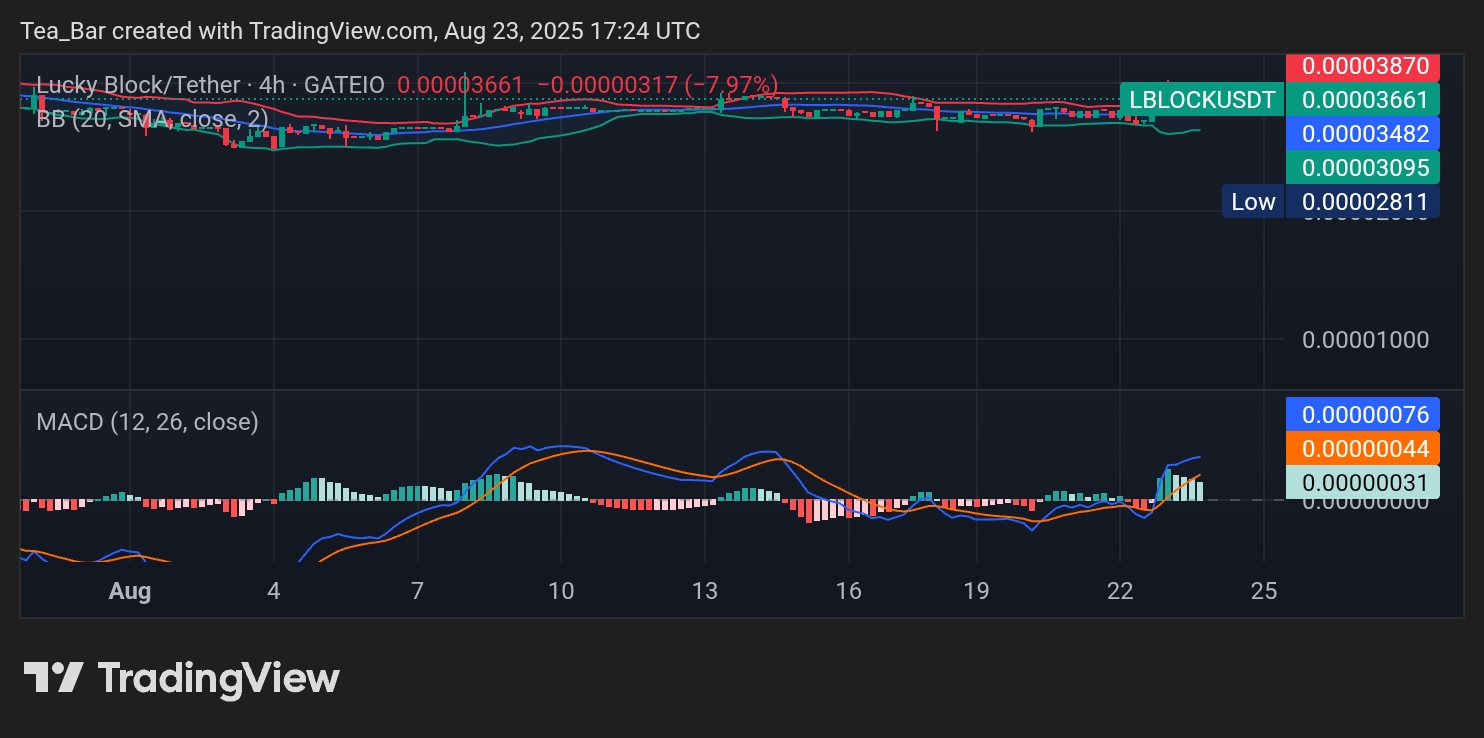
4-Hour Chart: Buyers Defend Key Support
Zooming into the 4-hour chart, LBLOCK is oscillating tightly between $0.00003482 support and $0.00003870 resistance. The Bollinger Bands on this timeframe echo the daily squeeze, with price pressing against mid-band levels. Such clustering around the bands often hints at accumulation before a decisive breakout.
Meanwhile, the MACD is showing encouraging signs of recovery. A recent bullish crossover has pushed the histogram back into green territory, signaling that buyers are reasserting control after the recent dip. Sustained strength above $0.00003661 could set the stage for a breakout test of $0.00003870, and a confirmed close above this barrier may open room toward $0.00004500.
Conclusion: Pressure Builds for LBLOCK’s Next Big Move
LBLOCK’s price action is marked by tightening ranges and momentum stabilization across both key timeframes. With Bollinger Band compression and a strengthening MACD, the token appears poised for a larger swing. Traders will be watching $0.00003870 as the critical breakout level, while $0.00003415 remains the key support floor to maintain bullish potential.
Invest wisely, and let Lucky Block’s potential work in your favor. You can purchase Lucky Block here. Buy LBLOCK.