Lucky Block (LBLOCK/USD) Market Retracts To The Upside
Estimated Reading Time: 3 minutes
Don’t invest unless you’re prepared to lose all the money you invest. This is a high-risk investment and you are unlikely to be protected if something goes wrong. Take 2 minutes to learn more

Lucky Block Price Prediction – May 7
LBLOCK/USD market retracts to the downside after the price hits the $0.00002900 major support. The market is converging in a triangle pattern. This is due to the price’s inability to make a successful breakout to either the upside or the downside.
The market’s overall trend has been bearish since the retraction from the supply zone at the $0.00009700 price level.
Following the second bounce off the major trendline, the price crashed massively to the downside. This confirmed the presence of bears in the market. Recently, the MA Cross signaled a buy as the price pulled backward due to the oversold state of the market, according to the RSI (Relative Strength Index).
LBLOCK/USD Market Key Levels:
Resistance levels: $0.00004500, $0.00007500, $0.00009700
Support levels: $0.00000290, $0.00000930, $0.00000120
LBLOCK/USD – Daily Chart
The LBLOCK/USD daily chart showcases that the market is currently retracing upward.
The market’s ongoing pullback is a result of the RSI’s indication. Owing to the oversold state of the market, LBLOCKUSD retracted upward as it headed into the premium zone.
Before the commencement of the downtrend, the price was consolidating just above $0.00000290 support. The consolidation lasted for about two months until the price eventually broke out in December 2024.
Following the breakout, prices rallied upward, only to be met by resistance at the $0.00009700 supply zone. The ensuing trend eventually led to the current overall trend of the market.

When will the LBLOCKRUSD market likely resume its bearish trend?
A major trendline emerged as prices crashed massively from the $0.00009700 supply zone. Technically, the price has been respecting the major trendline, as the trendline acts as a diagonal resistance.
The ongoing pullback is due to the indication of the RSI. Once the price hits the diagonal resistance and the overbought state is reached, the overall bearish trend is likely to resume.

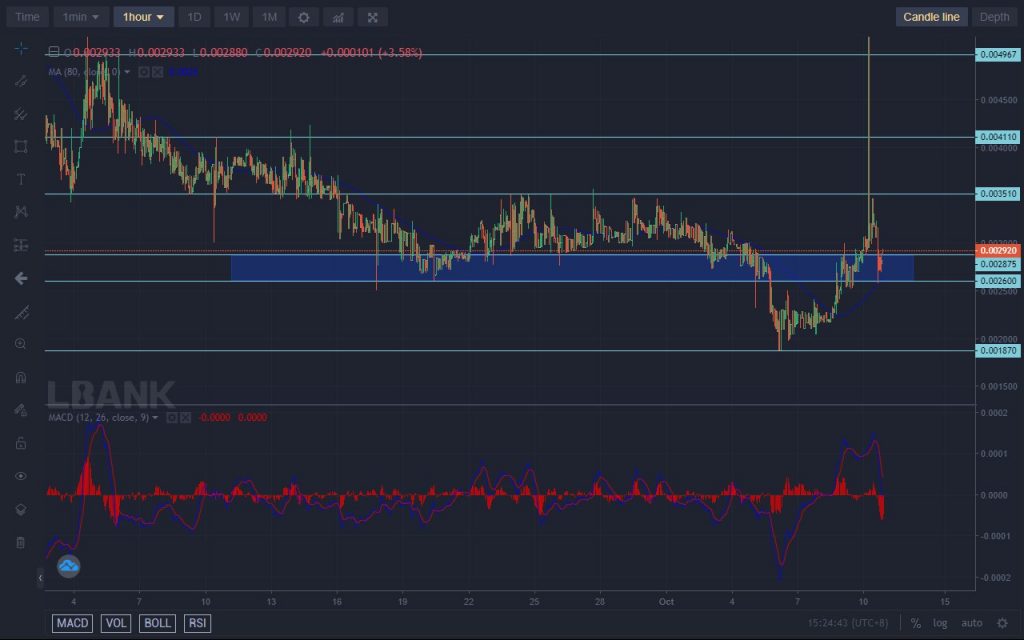
LBLOCK/USD – Four-Hour Chart
A CHoCH (Change of Character) to the upside occurred on April 19, 2024. This happened as the previous high of $0.00002750 was invalidated.
Owing to the RSI’s indication on the four-hour chart, a short-term decline to the four-hour diagonal support is probable. Following the decline, LBLOCK is expected to continue its rally.
Lucky Block (LBLOCK) Current Statistics
The current price: $0.00003550
Market Capitalization: $2,640,000
Trading Volume:$37,500
Place winning LEO trades with us. Get LEO here