$SPONGE (SPONGE/USD) Continues to Navigate the Possibility of a Price Rally at $0.000051
Estimated Reading Time: 3 minutes
Don’t invest unless you’re prepared to lose all the money you invest. This is a high-risk investment and you are unlikely to be protected if something goes wrong. Take 2 minutes to learn more

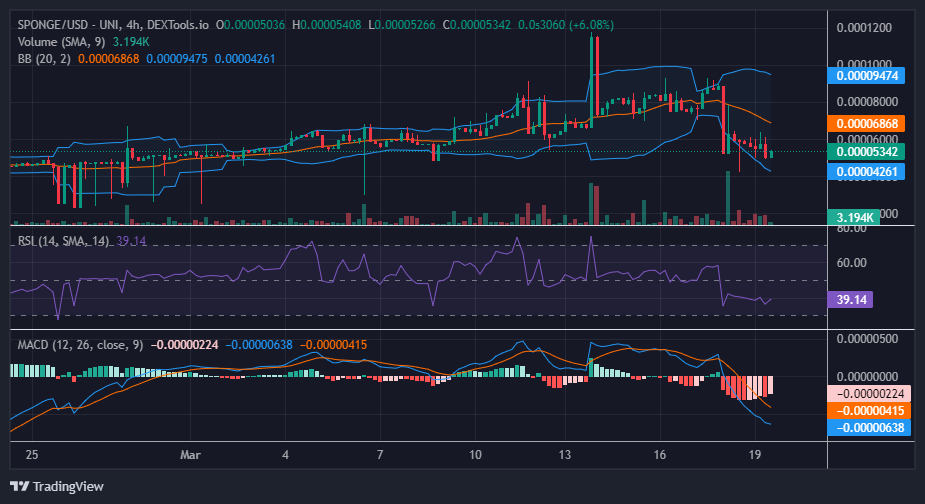
In our recent analysis, we observed that the emergence of a candlestick featuring a pronounced upper shadow, occurring at the conclusion of a brief bearish trend, may signify an accumulation of bullish momentum. This particular bullish candlestick follows a significant bearish marubozu candlestick. Such market dynamics suggest a potential transition in sentiment from bearish to bullish, accompanied by heightened trader engagement in the bullish trajectory. Nonetheless, the comparatively weaker strength of the ensuing bullish candlestick, relative to its preceding bearish counterpart, may suggest a degree of caution or uncertainty among $SPONGE traders, thereby prompting a deeper examination of market conditions.
Key Market Dynamics:
- Resistance Levels: $0.0010, $0.0011, and $0.0012.
- Support Levels: $0.000035, $0.000030, and $0.000025.
In-Depth Technical Analysis for $SPONGE (SPONGE/USD)
The significant Marubozu candlestick reflects the actions of prominent traders, indicating substantial buying activity by a select few individuals. While this surge in buying could initially trigger a bearish trend, the absence of significant trading volume suggests the trend’s lack of sustainability. This indicates a potential loss of momentum among $SPONGE sellers, potentially paving the way for an uptick in buying activity.
As anticipated, the subsequent trading session witnessed notable trading volume and the formation of a bullish candlestick. However, the bearish market has persisted below the $0.00006 price level, primarily due to the consistent presence of bears in the vicinity. Nevertheless, according to this crypto signal, there are indications from the Moving Average Convergence and Divergence (MACD) indicator that the lingering bearish pressure is diminishing. This is evident from the recent decrease in the intensity of the red histogram observed on the chart, offering a glimmer of hope for a potential reversal in market sentiment.
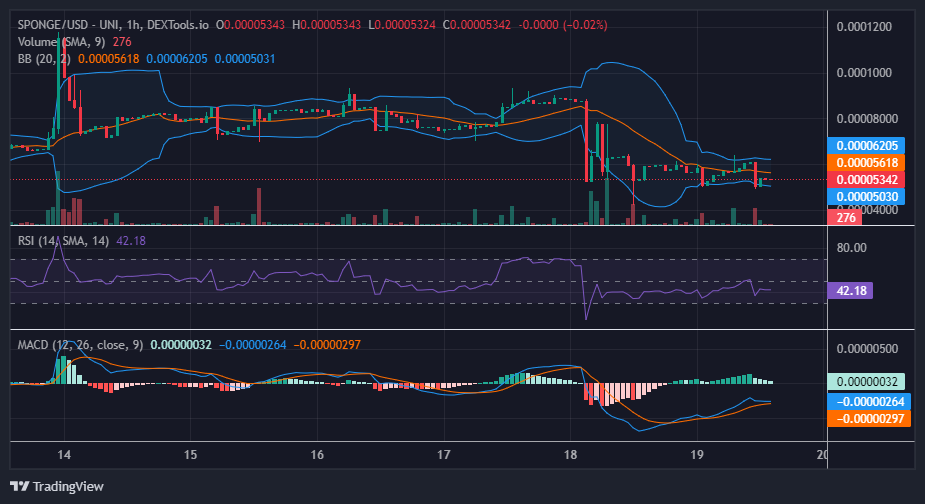
Insights from the 1-Hour Perspective
The Moving Average Convergence and Divergence (MACD) displayed on the 1-hour chart outlook has already indicated a bullish crossover, with both lines trending towards crossing above the zero level. This suggests an imminent price rally. Furthermore, in confirmation of the anticipated buildup of bullish momentum, the Bollinger Bands have converged, forming a narrow price channel.
With SpongeV2, you still have a chance; don’t pass it up again.
You still have a chance with #SpongeV2… don’t miss out again 💦$SPONGE #MemeCoin #Bullish pic.twitter.com/HuKpH3JTFI
— $SPONGE (@spongeoneth) March 19, 2024
Invest in the hottest and best meme coin. Buy Sponge ($SPONGE) today!