The 1Inch Market (1INCH/USD) Is Poised for a Potential Surge Above $0.700 as the Market Looks Bullish.
Estimated Reading Time: 3 minutes
Don’t invest unless you’re prepared to lose all the money you invest. This is a high-risk investment and you are unlikely to be protected if something goes wrong. Take 2 minutes to learn more
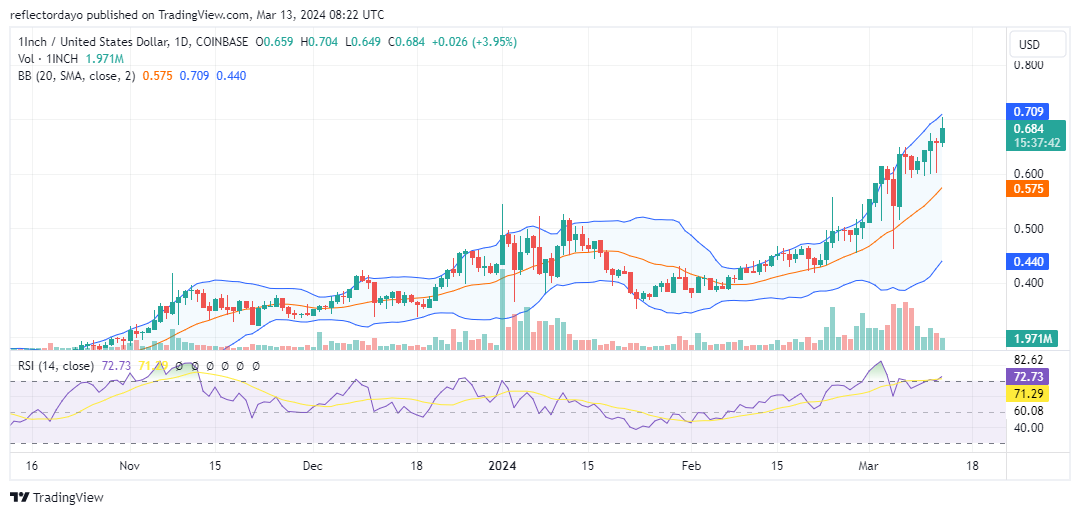
In early February, the 1Inch market initiated an upward trend. Initially, the bullish momentum appeared gradual and one-sided, with the price primarily confined above the 20-day moving average. As the price neared the $0.60 level, volatility increased, resulting in significant price fluctuations. However, the market swiftly surpassed the resistance at $0.60, effectively transforming it into a support level. This price movement suggests a potential continuation of the bullish trend.
1INCH Market Data
- 1INCH/USD Price Now: $0.688
- SOL/USD Market Cap: $ 786 million
- SOL/USD Circulating Supply: 1.1 billion
- SOL/USD Total Supply: 1.5 billion
- SOL/USD CoinMarketCap Ranking: #126
Key Levels
- Resistance: $0.70, $0.75, and $0.80.
- Support: $0.60, $0.55, and $0.50.
The 1INCH Market Analysis: The Indicators’ Point of View
As the 1Inch market entered the $0.60-$0.70 zone, heightened volatility persisted. This indicates that, despite the potential for bears to exploit this volatility and reverse the trend or stall progress at $0.60, bullish momentum remains dominant.
Following the price surpassing $0.60, repeated rejections of bearish attempts to reclaim this level have bolstered the $0.60 support. Additionally, the price action remaining within the upper Bollinger Bands and above the 20-day moving average suggests that the bulls may still have the upper hand, even though they face resistance at $0.70. A decisive break above this resistance could lead to a further increase in bullish sentiment.
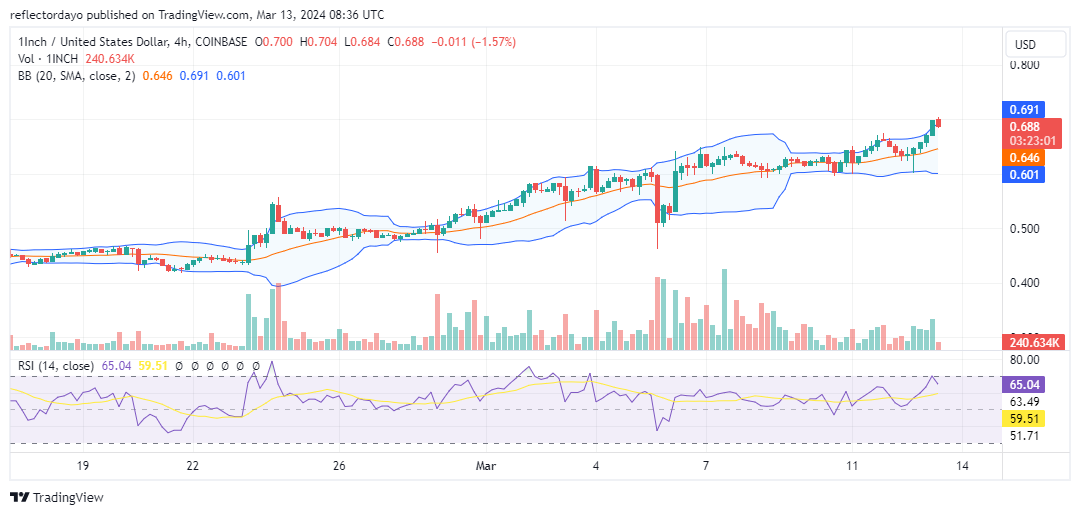
1INCH/USD 4-Hour Chart Outlook
On March 9th, during the current uptrend, Bollinger Bands indicated a notable decrease in trading volume. This potentially suggests a temporary equilibrium between buying and selling pressure around the $0.618 price level. However, a brief retest of the critical $0.60 support level triggered a renewed surge in bullish sentiment, propelling the price towards the $0.70 resistance.
This increase in volatility suggests a potential breakout above the resistance level. Nevertheless, exercising caution is advised. Traders should wait for the crypto signal that confirms a breakout above $0.70 before establishing long positions.