Solana (SOL/USD) Market Hits Strong Bearish Frontline; Can Bulls Overcome the Resistance?
Estimated Reading Time: 2 minutes
Don’t invest unless you’re prepared to lose all the money you invest. This is a high-risk investment and you are unlikely to be protected if something goes wrong. Take 2 minutes to learn more
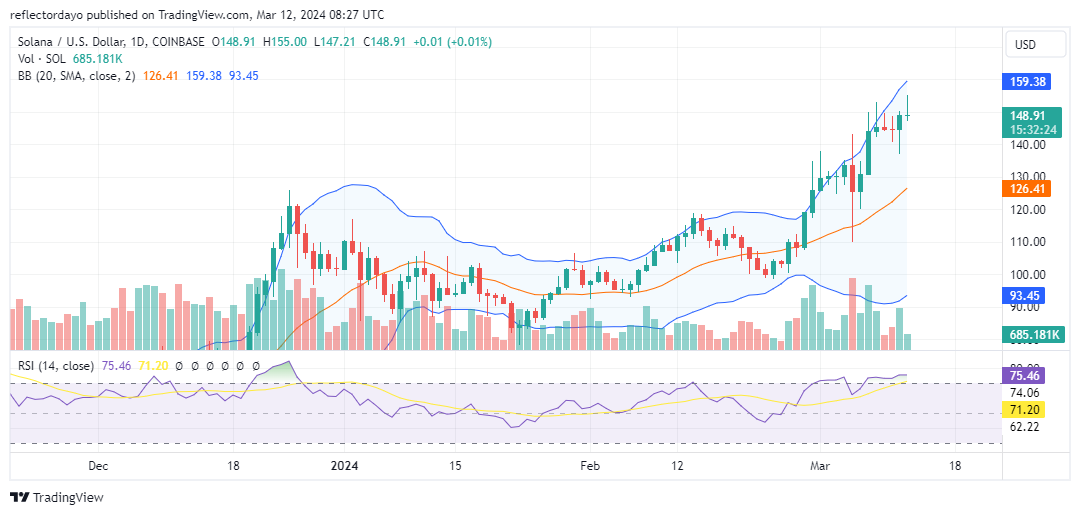
The Solana market is exhibiting early indications of a potential reversal. Since the start of March, there has been a pronounced upward trend, accompanied by heightened market volatility. This increased volatility is bolstering the bears’ strength around the $150 resistance level.
Solana Market Data
- SOL/USD Price Now: $149
- SOL/USD Market Cap: $66.5 billion
- SOL/USD Circulating Supply: 443 million
- SOL/USD Total Supply: 571 million
- SOL/USD CoinMarketCap Ranking: #5
Key Levels
- Resistance: $150, $155, and $160.
- Support: $140, $135, and $130.
Solana Market Analysis: The Indicators’ Point of View
The indicators suggest an imminent reversal of the current upward market trend. Firstly, today’s Solana crypto signal is characterized by a shooting star candlestick, featuring a long upper shadow and a shorter lower shadow. This pattern typically signals a trend reversal, particularly noteworthy as it appears at the apex of a bullish trend, around a key resistance level. The repeated testing of the $150 resistance level since March 7 has fortified its significance, with continued rejection bolstering its status as a formidable barrier. Furthermore, the RSI’s sideways movement subsequent to crossing the 70 level indicates a potential trend reversal.
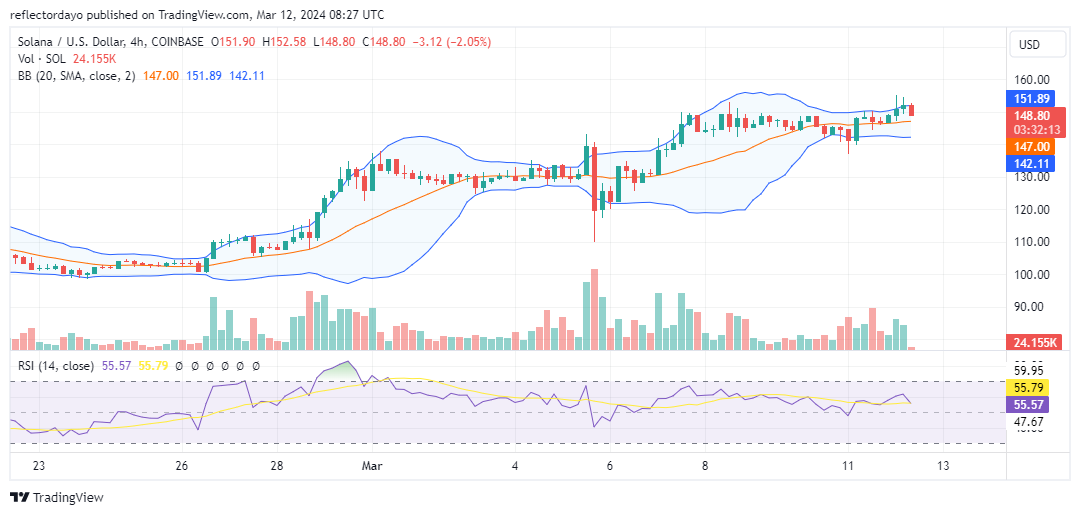
SOL/USD 4-Hour Chart Outlook
Upon analysis of the 4-hour chart for the Solana market, a pattern of consistent rejection is observed around the $150 price level. While there have been occasional excursions above $150, the majority of price action has remained below this threshold. This trend suggests a growing bearish sentiment, fueled by the market’s inability to sustain movement beyond $150. Should this bearish momentum persist, it is conceivable that bullish support may emerge around the $130 level. However, it is important to note that the current support level stands at $140, and a breach below this level could prompt further bearish activity unless bulls intervene at $130.