Polkadot Surges Ahead, Targets the $17 High
Estimated Reading Time: 2 minutes
Don’t invest unless you’re prepared to lose all the money you invest. This is a high-risk investment and you are unlikely to be protected if something goes wrong. Take 2 minutes to learn more
Polkadot (DOT) Long-Term Analysis: Bearish
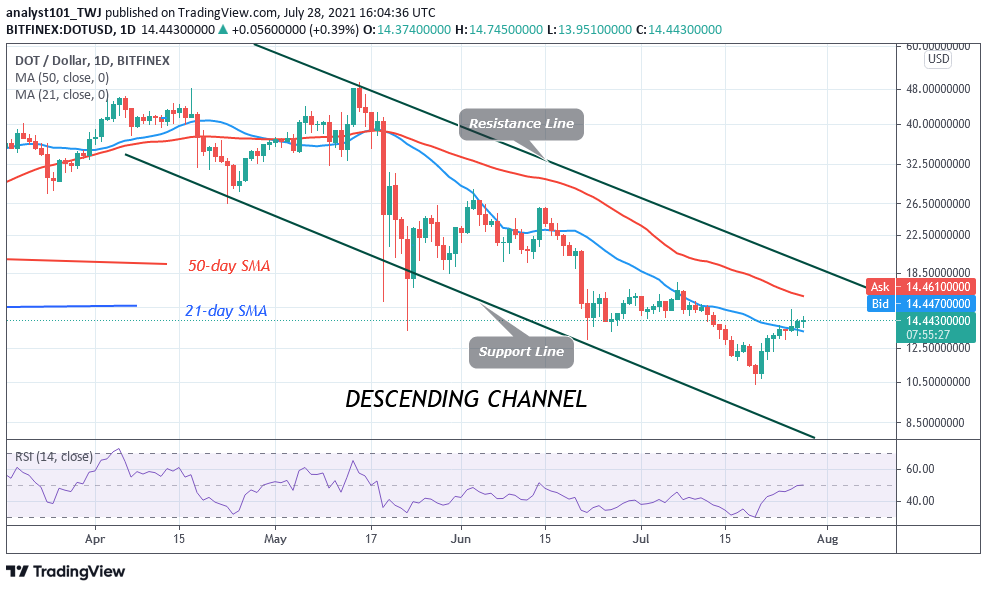
For the past week, Polkadot’s (DOT) price has continued to rise on the upside without a pullback. Today, the altcoin has risen to the high of $14.44 and further upside is likely. However, on July 26, buyers were unable to push the altcoin above the $15 resistance. The bulls were repelled after retesting the resistance twice. On the upside, if the bulls breached the $15 resistance, the market will rally above the $17 high. Polkadot will decline to the previous low at $13 if it faces rejection at the recent high.
Polkadot (DOT) Indicator Analysis
Polkadot is at level 50 of the Relative Strength Index period 14. It indicates that there is a balance between supply and demand.DOT price is above the 50% range of the daily stochastic. The altcoin is in a bullish momentum. The 21-day and 50-day SMAs are sloping northward indicating the uptrend.
Technical indicators:
Major Resistance Levels – $48, $52, $56
Major Support Levels – $32, $28, $24
What Is the Next Direction for Polkadot (DOT)?
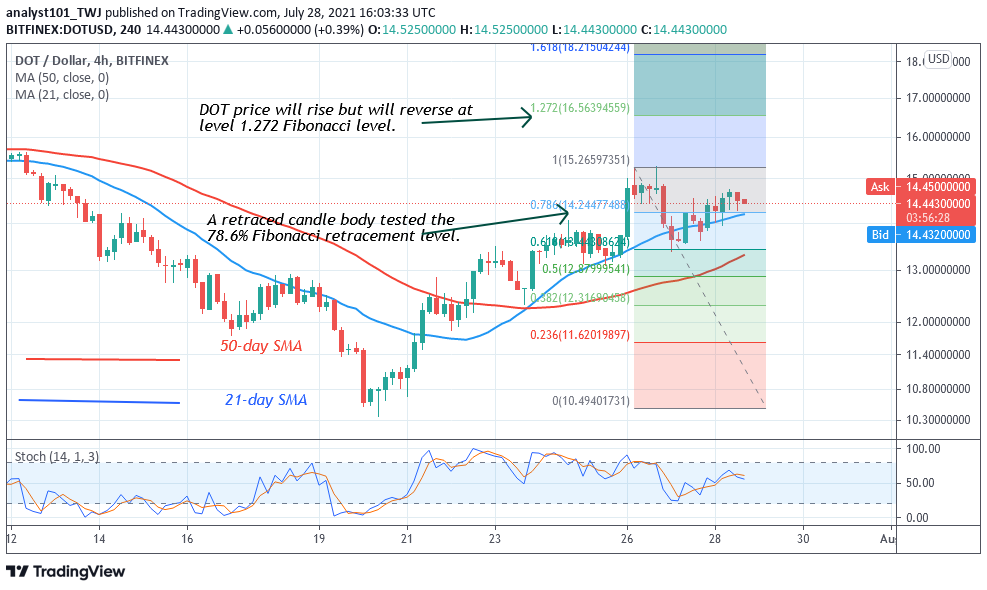
Polkadot has resumed upward. The crypto is yet to reach the bullish trend zone above the $22 high. Meanwhile, on July 26 uptrend; a retraced candle body tested the 78.6% Fibonacci retracement level. The retracement indicates that DOT price will rise but reverse at level 1.272 Fibonacci extension or level $16.56.
You can purchase crypto coins here. Buy Tokens
Note: Cryptosignals.org is not a financial advisor. Do your research before investing your funds in any financial asset or presented product or event. We are not responsible for your investing results