Polygon (POL) Price Prediction: POL/USDT Market Keeps to Minimal Gains
Estimated Reading Time: 2 minutes
Don’t invest unless you’re prepared to lose all the money you invest. This is a high-risk investment and you are unlikely to be protected if something goes wrong. Take 2 minutes to learn more

Polygon (POL) Price Prediction: October 6
The Polygon market continues to witness weakened participation, with the price retreating below the $0.4000 threshold. In recent sessions, the market has rebounded slightly but posted only minimal gains.
POL/USDT Long-term Trend: Bullish (Daily Chart)
Key Price Levels:
Resistance: $0.40, $0.4250, $0.4500
Support: $0.3500, $0.3300, $0.3100
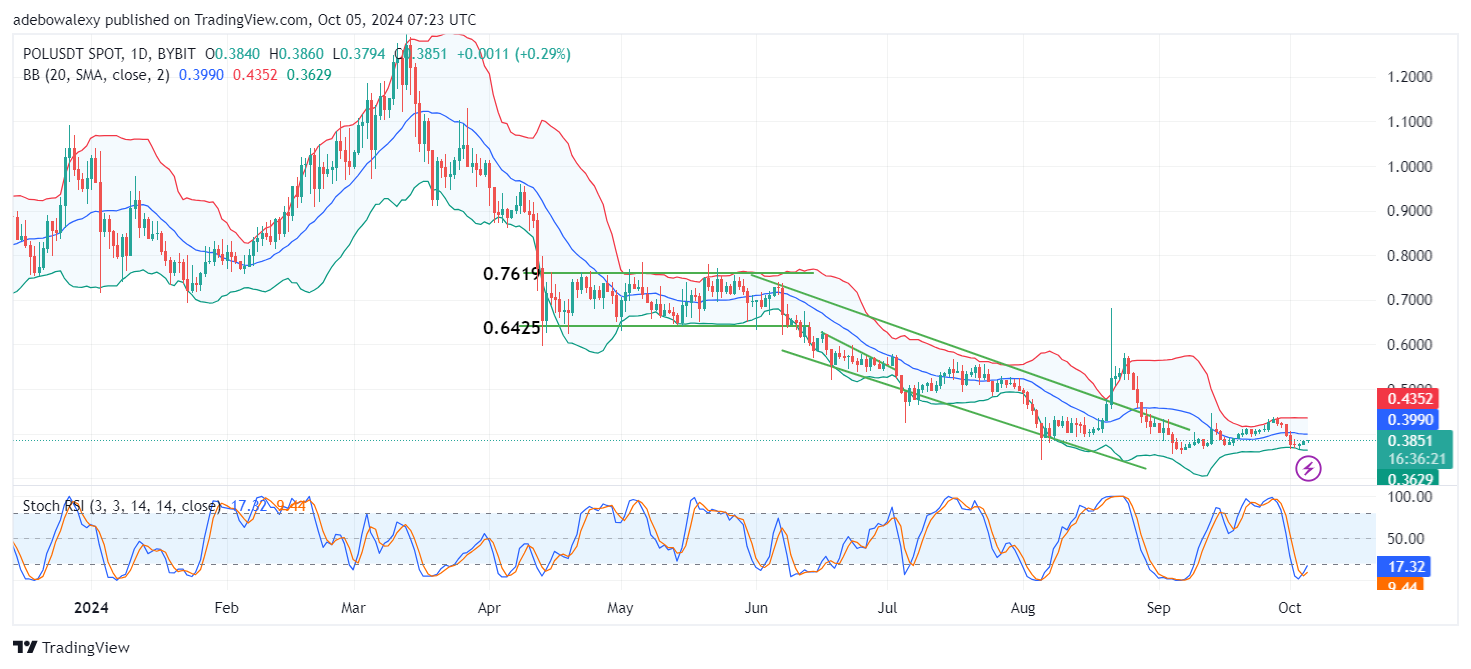
Price action in the Polygon token daily market shows minimal upward momentum after hitting the lower band of the Bollinger Bands (BB) indicator. The slight upside retracement is heading toward the middle limit of the BB bands. The Stochastic Relative Strength Index (Stochastic RSI) lines rise from deep in the oversold region, indicating potential bullish momentum.
Polygon (POL) Price Prediction: POL/USDT Continues to Face Challenges
In the POL/USDT daily chart, the upper limit of the BB indicator presents formidable resistance to upward movement. As a result, price activity has moved downward, dipping below the $0.4000 threshold. Recently, the market has seen only minimal upward retracements toward the middle of the BB indicator. The Stochastic RSI lines suggest that bullish momentum is on the rise despite the overall declining trend. However, expectations for a significant upward move remain low.
Polygon (POL) Price Prediction: POL/USDT Hints at Some Positivity (4-Hour Chart)
In the 4-hour time frame, the Polygon market shows some positive signs. The most recent price candle is green and supported above the middle limit of the BB indicator. Additionally, the behavior of the BB indicator suggests that upward forces may gain more traction.
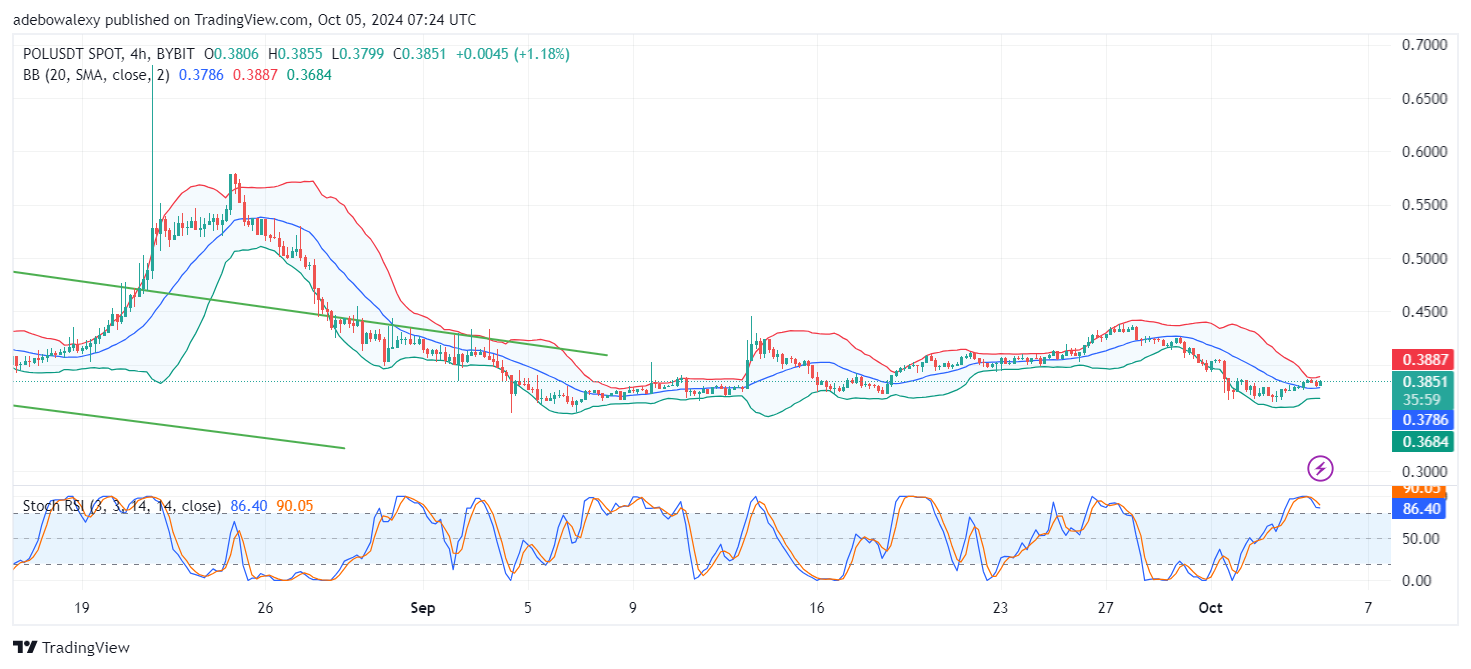
Meanwhile, the Stochastic RSI lines are approaching an upside crossover above the 80 level, signaling potential bullish strength. However, market participation is necessary to sustain an upward breakout above $0.4000 and possibly toward the $0.4250 threshold.


