Bears Maintain Control as Quant (QNT) Lingers Around $114 Level
Estimated Reading Time: 3 minutes
Don’t invest unless you’re prepared to lose all the money you invest. This is a high-risk investment and you are unlikely to be protected if something goes wrong. Take 2 minutes to learn more
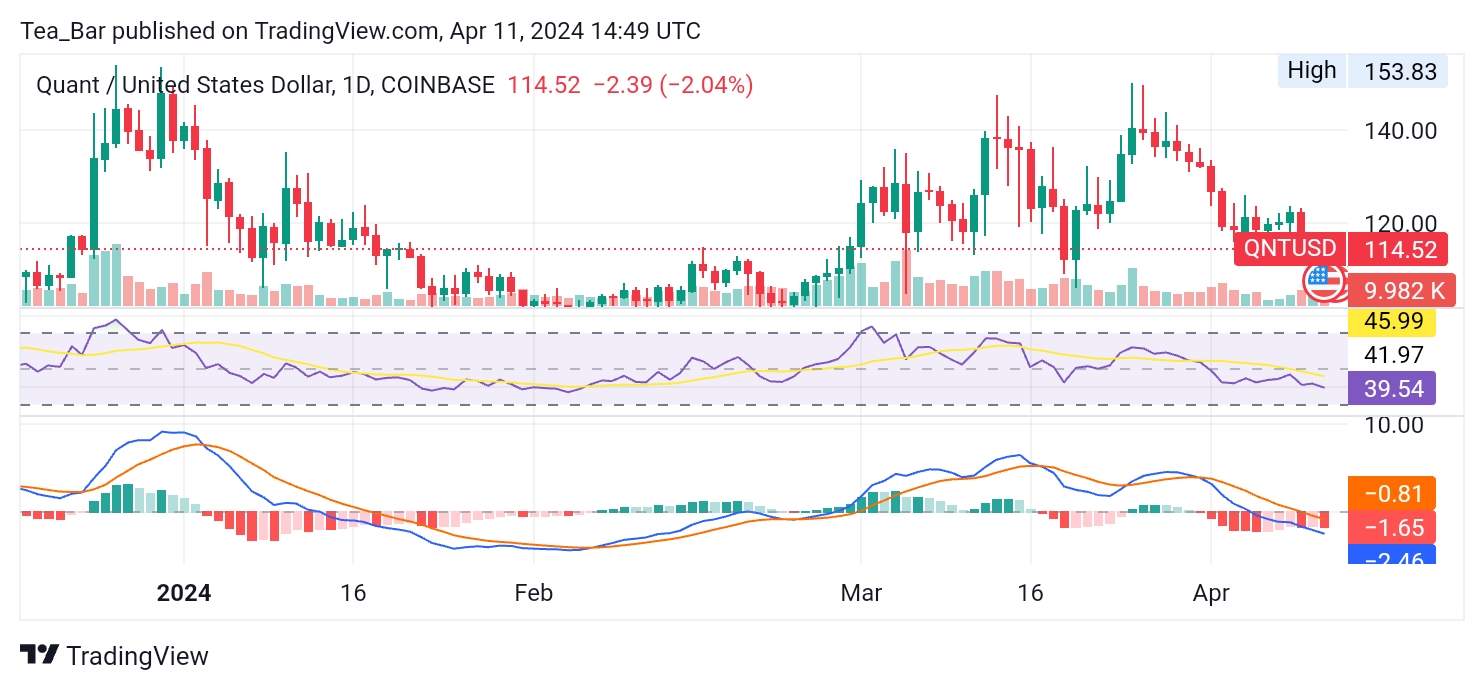
At $114, Quant (QNT) finds itself in a holding pattern, with bearish forces asserting dominance. While there are occasional attempts from bullish traders to spur upward momentum, they are consistently met with resistance.
This equilibrium reflects a cautious market sentiment, as investors await clearer signals before committing to decisive action. With both bulls and bears closely monitoring price movements, the $114 level serves as a pivotal point, indicating the ongoing tug-of-war between opposing forces in the QNT market.
QNT/USD Long-term Trend: Bearish (Daily Chart)
Key levels:
Resistance Levels: $116, $118, $120
Support Levels:$112, $110, $108
Quant (QNT) encounters formidable resistance at $116, $118, and $120, acting as significant barriers to its upward momentum. Conversely, the support levels at $112, $110, and $108 provide a safety net, offering stability amidst market fluctuations.
Traders must remain vigilant, closely monitoring these levels for potential breakouts or reversals, and adjusting their strategies accordingly to capitalize on market opportunities.
Could There Be a Turning Point for QNT?
As Quant (QNT) lingers at $114, traders scrutinize this level as a potential turning point amidst a delicate balance of supply and demand. With support established at $112 and resistance looming at $116, the price is at a critical juncture.
A decisive move above $116 could trigger bullish sentiment, while a downturn below $112 may invite bearish pressures.
QNT/USD Medium-term Trend: Bearish (4H Chart)
Based on the 4-hour chart analysis, Quant’s price lingers around $114. Meanwhile, the MACD has a bearish crossover as reflected by the blue line crossing below the signal line. This often signals potential downward momentum. 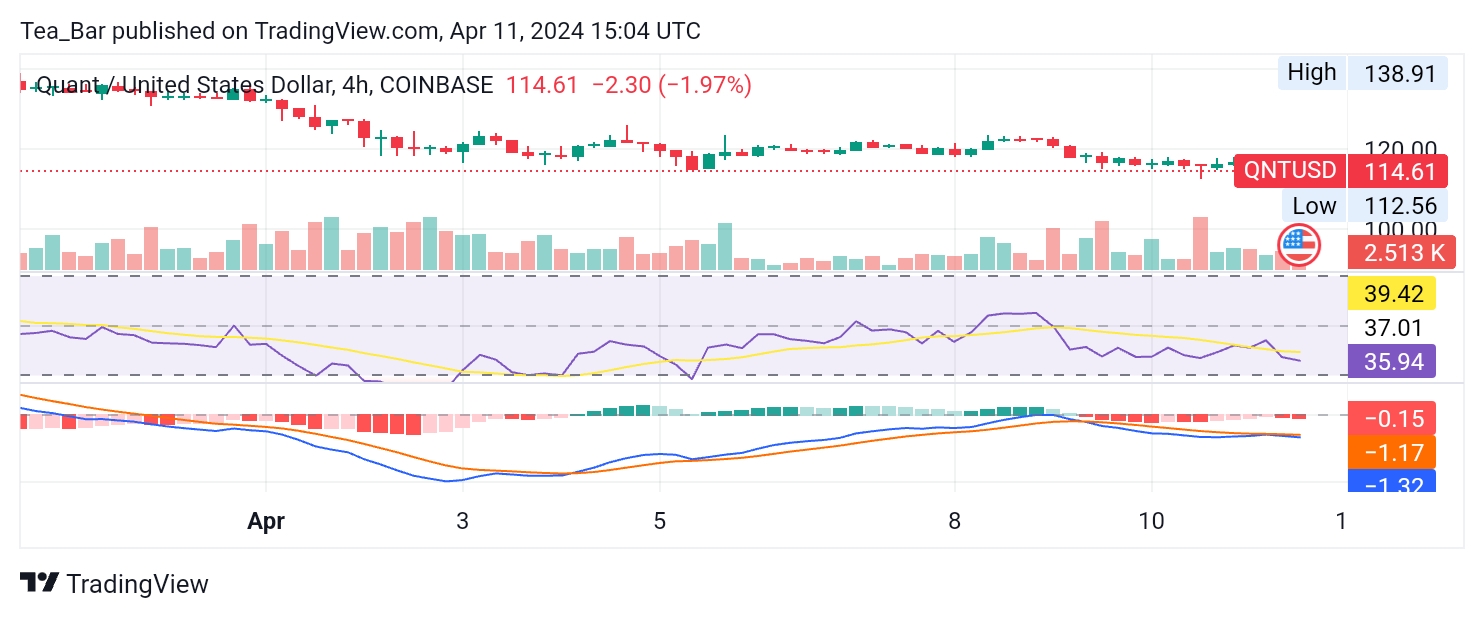
The histogram also shows a series of red bars reinforcing the bearish sentiment. The RSI line can also be seen moving downward which further emphasizes the bearish trend.
However, Quant has been achieving notable successes in its fundamental aspects, as evidenced by a recent blog post emphasizing how it can advance CBDC technology with its multichain and composability features.
Already serving numerous financial institutions and enterprises, Quant recently partnered with the Bank for International Settlements and the Bank of England for its Rosalind project.
Despite philosophical opposition from some in the crypto community towards CBDCs, Quant’s involvement in designing such technology is expected to increase demand for its utility token, potentially driving its price up in 2024.
Place winning Quant trades with us. Get QNT here.