Quant (QNT) Bulls Take Over: Price Dips to $116, Soars to $123.43
Estimated Reading Time: 3 minutes
Don’t invest unless you’re prepared to lose all the money you invest. This is a high-risk investment and you are unlikely to be protected if something goes wrong. Take 2 minutes to learn more

The Quant market witnesses a dramatic narrative as bulls take the lead, following the price dip in the last six days. In the previous trading session, Quant experienced a low of $116 before roaring to $123.
This rapid surge highlights the resilience of bullish sentiment and heralds a pivotal moment in market dynamics. Investors take note of Quant’s impressive momentum, signaling a promising outlook amidst evolving market conditions.
QNT/USD Long-term Trend: Bullish (Daily Chart)
Key levels:
Resistance Levels: $125, $127, $130
Support Levels: $120, $118, $116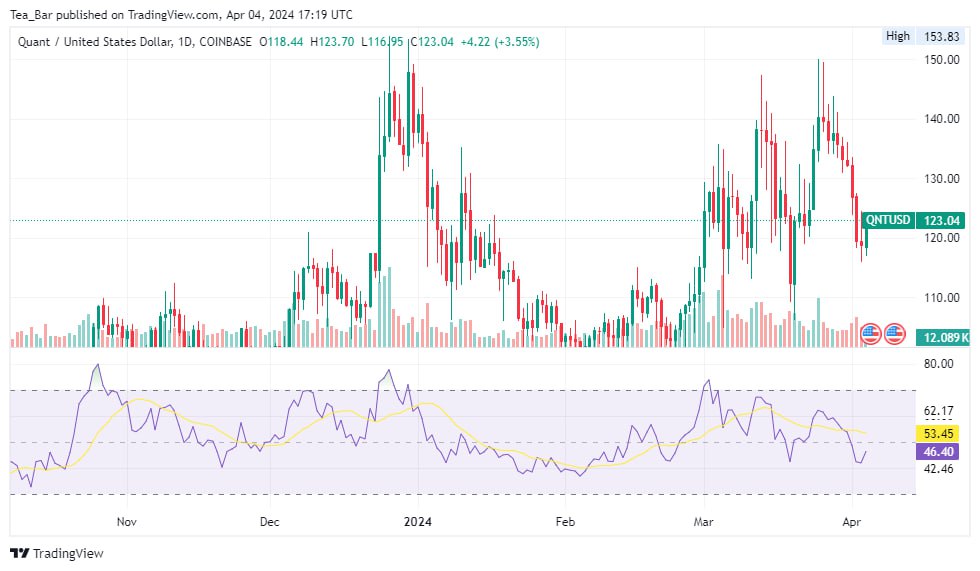
At $123, Quant’s bullish stance is unmistakable, buoyed by promising support and resistance levels. With resistance barriers identified at $125, $127, and $130, and solid support zones at $120, $118, and $116, the market is primed for upward momentum.
Investors are optimistic about Quant’s trajectory, anticipating breakthroughs as it navigates these key levels. The alignment of technical indicators suggests a favorable outlook, fostering confidence in Quant’s continued bullish prospects.
QUANT Price Prediction: QNT Set to Reach $125 Resistance Mark
As QNT edges closer to the $125 resistance level, anticipation mounts among investors. This imminent milestone represents a critical juncture in QNT’s trajectory, signifying its resilience and potential for upward movement.
The market watches closely as QNT navigates towards this pivotal point, poised to redefine its position and reinforce its bullish momentum. Amidst evolving market conditions, the approach to $125 underscores QNT’s strength and determination in the face of challenges, capturing attention and fueling optimism.
QNT/USD Medium-term Trend: Bullish (4H Chart)
Based on the 4-hour chart analysis, Quant’s price stabilizes around $123.1, with the coin lingering in a consolidated state. 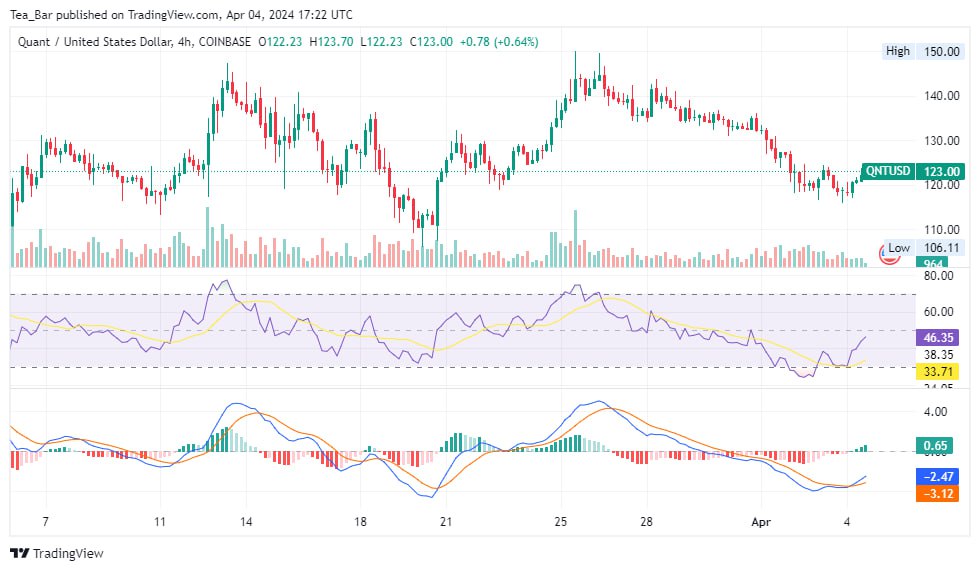
Yet, with the MACD and RSI indicators showing bullish signals, there’s potential for an upward surge. Should the bulls exert more pressure, Quant could breach the $125 resistance level and ascend further.
Investors monitor closely, anticipating whether the momentum indicated by the MACD and RSI will translate into sustained upward movement beyond the $125 mark.
Place winning Quant trades with us. Get QNT here.