Quant (QNT) Price Analysis: Bearish Trend with Signs of Rebound
Estimated Reading Time: 2 minutes
Don’t invest unless you’re prepared to lose all the money you invest. This is a high-risk investment and you are unlikely to be protected if something goes wrong. Take 2 minutes to learn more

Quant (QNT) Price Analysis – June 14
Quant (QNT) at the time of writing, trades at $82.87, with a 24-hour trading volume of $11,367,427. Over the past day, the price of QNT has decreased by 1.47%, starting from an opening of $83.10, reflecting a slight decline of 0.28% from its opening value.
Despite recent declines, Quant has rebounded by 4.41% from its recent lows, indicating some resilience in its price action.
Daily Chart Analysis
On the daily chart, Quant is exhibiting a bearish trend as indicated by its Bollinger Bands and RSI. The Bollinger Bands show a widening range with the upper band at 95.2, middle band at 88.9, and lower band at 82.5. This widening typically suggests increased volatility. 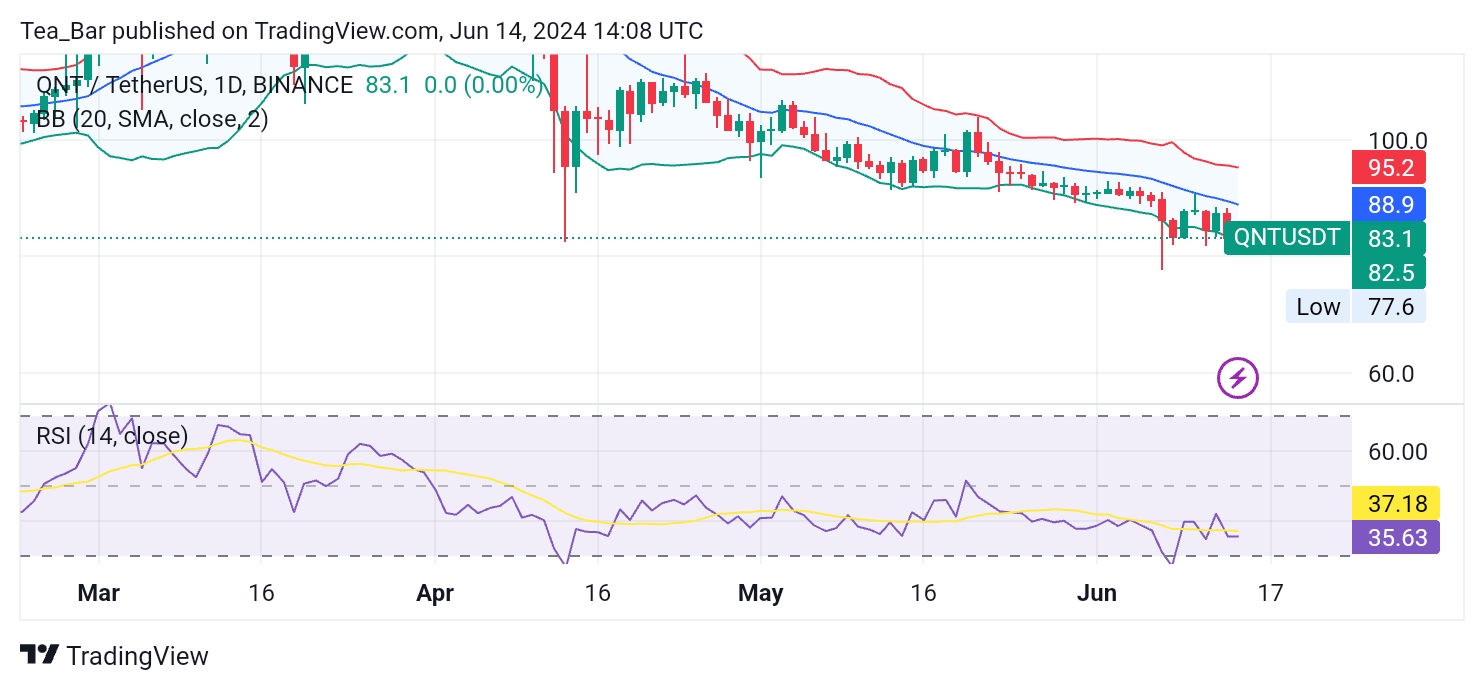
The RSI is currently at 35, indicating that Quant is in oversold territory. This oversold condition could potentially lead to a reversal or a period of price stabilization.
The recent price decline from the 30-day high of $102.97 (a decrease of 19.57%) suggests caution, but the rebound from recent lows indicates possible buying interest at lower levels.
4-Hour Chart Analysis
Looking at the 4-hour chart, Quant’s price movement is contained within narrower Bollinger Bands compared to the daily chart. The upper band is at 87.4, middle band at 84.4, and lower band at 81.3, indicating reduced volatility on this timeframe. 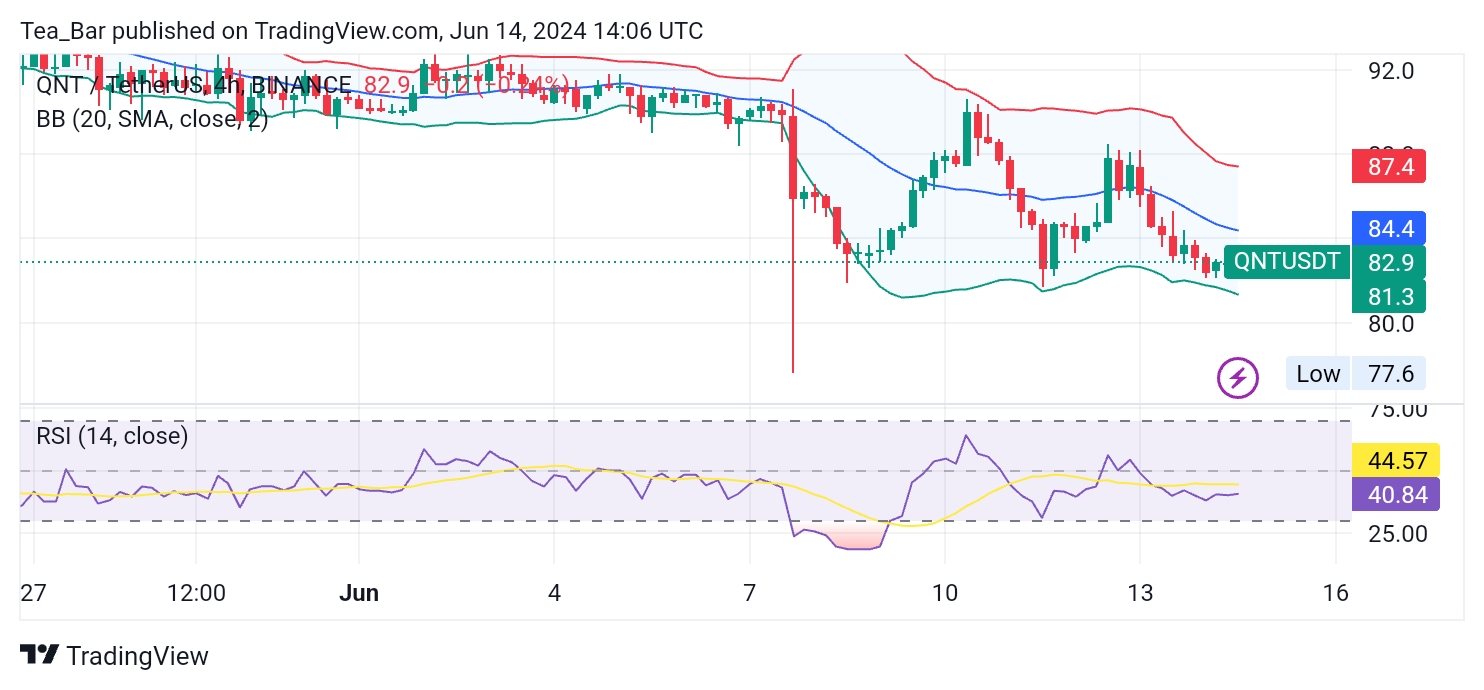
The RSI on the 4-hour chart is at 40, suggesting moderate momentum without extreme oversold or overbought conditions. This could imply a period of consolidation or a stabilization phase for Quant in the short term.
Conclusion
In conclusion, Quant (QNT) has experienced recent price declines from its highs, but has shown resilience with a rebound from lows. The oversold conditions on the daily RSI suggest a potential for a reversal or stabilization in price.
On the 4-hour chart, the moderate RSI and narrower Bollinger Bands indicate a potential for stability or minor upward movement in the short term.
Place winning Quant trades with us. Get QNT here.