QNT/USD: Where Next for the Quant Price?
Estimated Reading Time: 3 minutes
Don’t invest unless you’re prepared to lose all the money you invest. This is a high-risk investment and you are unlikely to be protected if something goes wrong. Take 2 minutes to learn more

QNT/USD Price Analysis – June 6
Quant (QNT) is trading at $90.69. In the past 24 hours, 134,310 QNT coins have been exchanged, resulting in a trading volume of $12,175,608. The price has increased by 0.26% over this period. Currently, the QNT price is 0.14% higher than its opening price of $90.53.
However, it has experienced a decline of 12.03% from its maximum price over the last 30 days and 2.25% from its maximum price over the last 7 days. From the minimum recorded price in these periods, the price has risen by only 1.56%.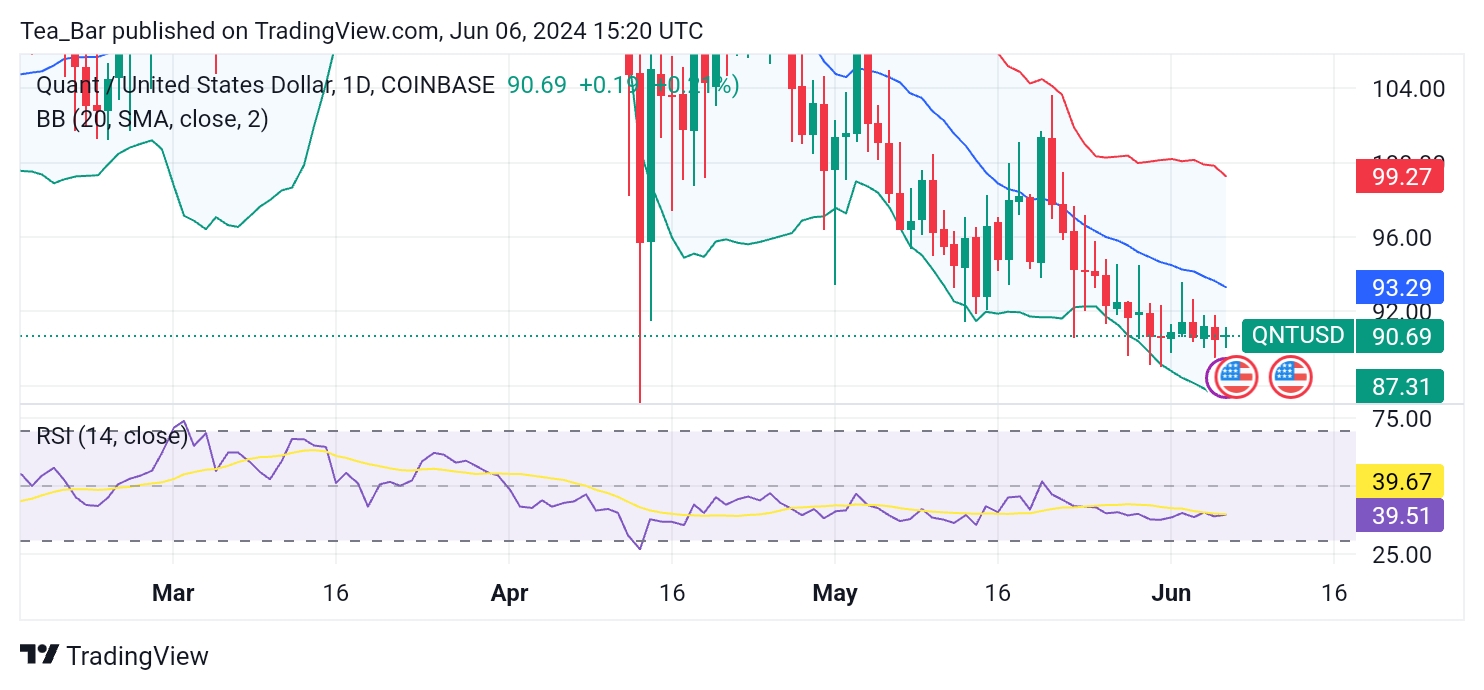
Daily Chart Analysis
Currently, the price of QNT is $90.69, which is below the middle band of $93, indicating it is closer to the lower band of $87. This positioning suggests that QNT might be oversold, especially since the price is significantly below the upper band of $99.
An RSI below 30 typically indicates that an asset is oversold, while an RSI above 70 suggests it is overbought. With an RSI of 39, QNT is on the lower end of the neutral zone, suggesting a lack of strong momentum either way but leaning towards an oversold condition.
4-Hour Chart Analysis
On a 4-hour timeframe, QNT’s price is close to the middle band of $90, trading at $90.57. This suggests a more stable position within the Bollinger Bands compared to the daily timeframe. The proximity to the middle band indicates that QNT is neither oversold nor overbought on this shorter timeframe.
On the 4-hour chart, the RSI stands at 47, which is closer to the midpoint of the RSI scale. This neutral position indicates a balanced momentum without significant bullish or bearish pressure.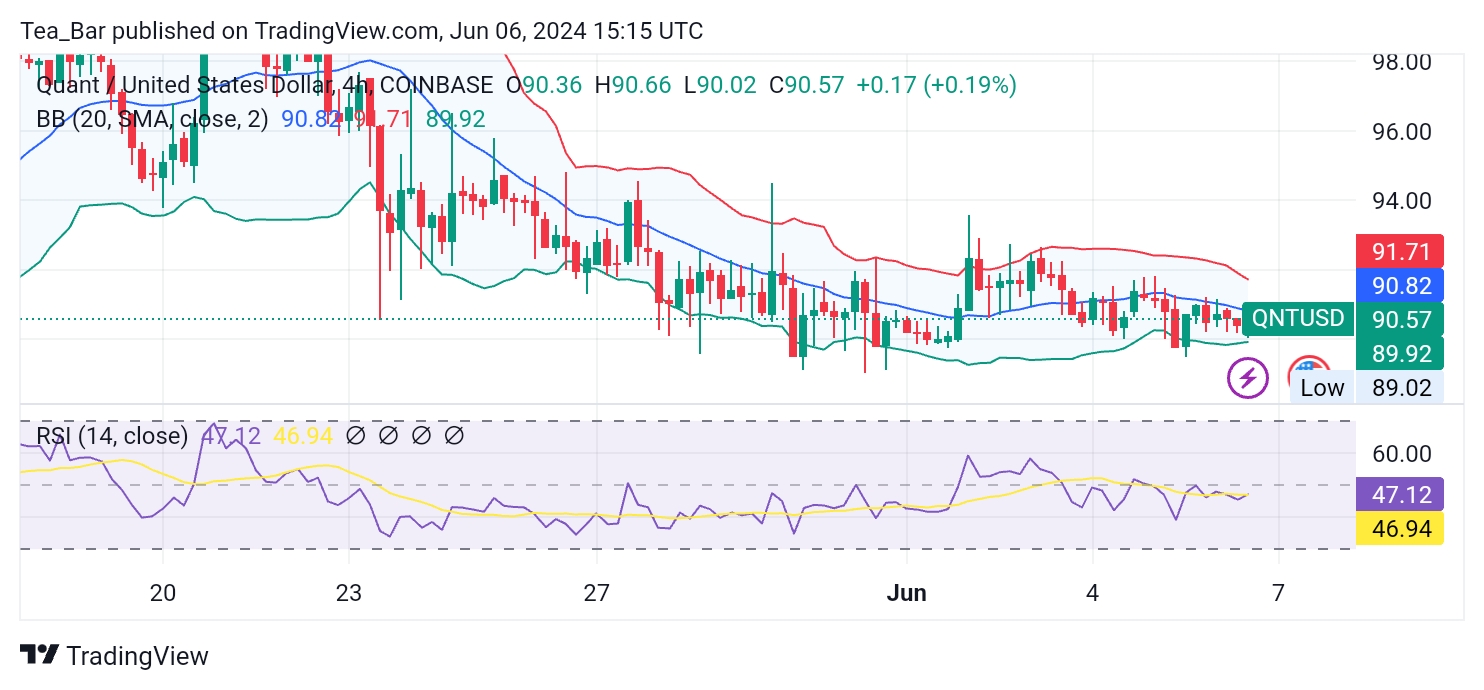
Analysis and Conclusion
The current technical indicators for Quant (QNT) provide mixed signals. The daily Bollinger Bands suggest the possibility of the asset being oversold, given its position below the middle band and approaching the lower band. The daily RSI supports this view, being closer to the oversold threshold.
However, the 4-hour indicators present a more neutral stance with the price near the middle Bollinger Band and an RSI that does not indicate any strong momentum in either direction.
Given the broader downward trend observed over the past 30 and 7 days, traders might be cautious about entering new long positions without further confirmation of a reversal. The proximity to lower Bollinger Bands on the daily chart and the relatively low RSI could attract buyers looking for potential short-term gains.
Conversely, the neutrality on the 4-hour chart suggests that the market could remain range-bound in the short term, awaiting a clearer directional move.
Place winning Quant trades with us. Get QNT here.