Ripple (XRP) Is in a Range as It Battles the Resistance at $0.40
Estimated Reading Time: 2 minutes
Don’t invest unless you’re prepared to lose all the money you invest. This is a high-risk investment and you are unlikely to be protected if something goes wrong. Take 2 minutes to learn more
Ripple (XRP) Long-Term Analysis: Bullish
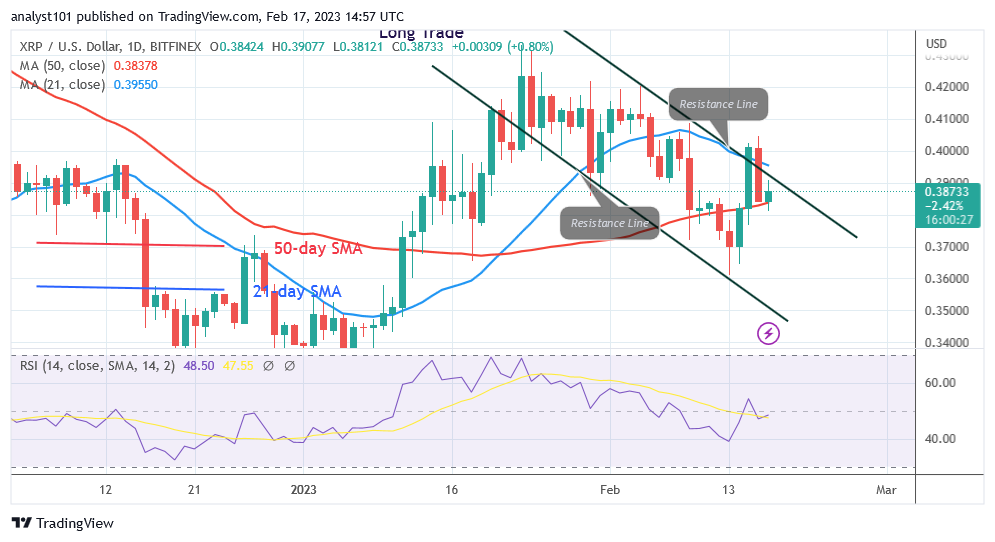
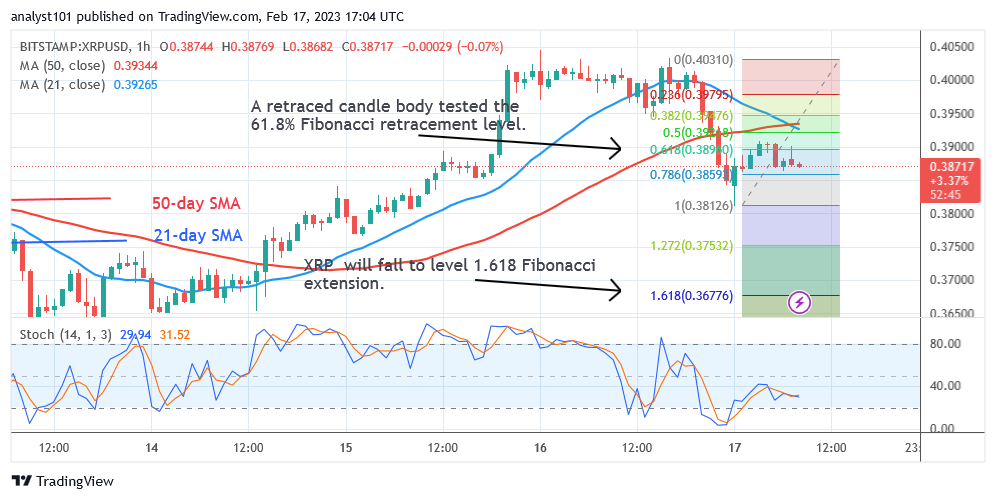
Ripple (XRP) price is declining as it battles the resistance at $0.40. XRP is currently entrapped between the moving average lines as a result of the rejection. Cryptocurrency is once again range-bound in this area. The altcoin will trend when the moving average lines cross. For instance, the price of XRP will drop to its previous low if the 50-day line SMA is broken. In other words, XRP will fall to its prior low of $0.36. If the price rises over the 21-day line SMA, XRP will resume its bullish trend. The upward trend has been restrained to the upside by the barrier at $0.40. While XRP is now trading at $0.39, it is constrained by the moving average lines.
Ripple (XRP) Indicator Analysis
Ripple is confined between the moving average lines. When the moving average lines are crossed, the altcoin will trend. The Relative Strength Index for period 14 has dropped to level 48, suggesting that the coin may tumble. Below the daily Stochastic threshold of 40, there is a bearish momentum for the altcoin.
Technical indicators:
Major Resistance Levels – $2.00, $2.50, $3.00
Major Support Levels – $1.50, $1.00, $0.50
.What Is the Next Direction for Ripple (XRP)?
Ripple is pinned between the moving average lines as it battles the resistance at $0.40. Since that XRP is entrapped between the moving average lines, the market’s direction is uncertain. The price of cryptocurrency is currently increasing to overcome the barrier at $0.40 or the 21-day line SMA.
You can purchase crypto coins here. Buy LBLOCK
Note: Cryptosignals.org is not a financial advisor. Do your research before investing your funds in any financial asset or presented product or event. We are not responsible for your investing results