Shiba Inu (SHIBUSD) Retracts at $0.00000600; Undervalued Market Persists
Estimated Reading Time: 2 minutes
Don’t invest unless you’re prepared to lose all the money you invest. This is a high-risk investment and you are unlikely to be protected if something goes wrong. Take 2 minutes to learn more
SHIBUSD Analysis: Price Retracts At $0.00000600 As The Market Becomes Undervalued
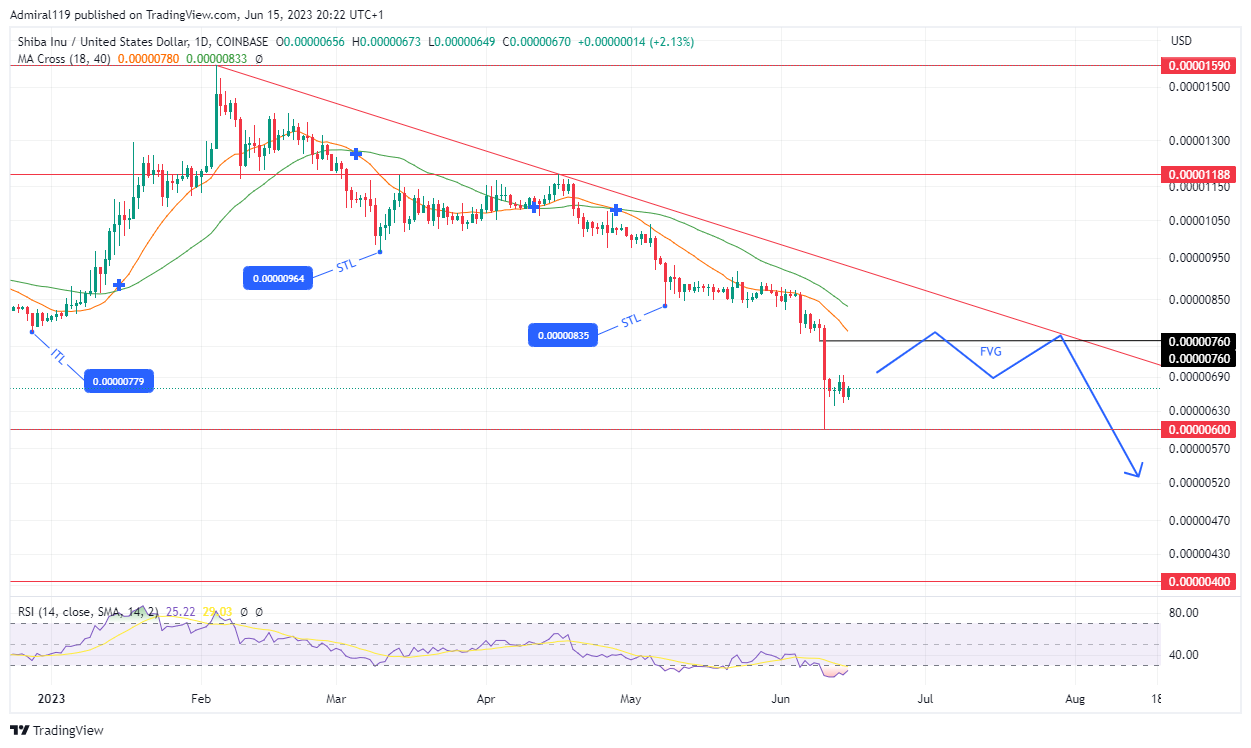
SHIBUSD retracts at $0.00000600 as the market becomes undervalued. The market’s bearish trend has begun since the RSI (Relative Strength Index) signaled that SHIBUSD was overpriced. The price cleared weak lows until it reached the $0.00000600 demand zone.
SHIBUSD Significant Zones
Demand Zones: $0.00000600, $0.00000400
Supply Zones: $0.00001200, $0.00001590

According to the MA Cross, the market is in a downward trend. Until the market structure shift occurs through the failure of the major trendline, SHIBUSD should remain bearish. The major trendline happened to be a falling trendline, which emerged alongside the commencement of the downward trend. In response to the indication of an undervalued state by the RSI, the price retracted at the $0.00000600 demand zone. The bears’ momentum has been weakened by the buying pressure from the demand zone at $0.00000600. SHIBUSD seems to be in for an upward retracement as it struggles to break the $0.00000600 level to the downside.
Since the creation of the intermittent low at $0.00000780, the market has surged more rapidly upward. The price’s impressive volatility ended quickly due to a large amount of selling pressure. The u-turn to the downside happened at the $0.00001590 price level. SHIBUSD sank lower to create a short-term low (STL) at $0.00000960. Due to the crash, another short-term low formed at the $0.00000840 price level. The short-term low only lasted a month before the dominant bearish movement broke it.

Market Expectation
There is a triangle pattern forming on the four-hour chart. This happened because the price reacted to the $0.00000600 demand zone. The price is expected to rise until it reaches the major trendline.
You can purchase Lucky Block here. Buy LBLOCK
Note: Cryptosignals.org is not a financial advisor. Do your research before investing your funds in any financial asset or presented product or event. We are not responsible for your investing results.