Ankr (ANKR/USD) Stages a Strong Bullish Recovery After Prolonged Bearish Trend
Estimated Reading Time: 5 minutes
Don’t invest unless you’re prepared to lose all the money you invest. This is a high-risk investment and you are unlikely to be protected if something goes wrong. Take 2 minutes to learn more

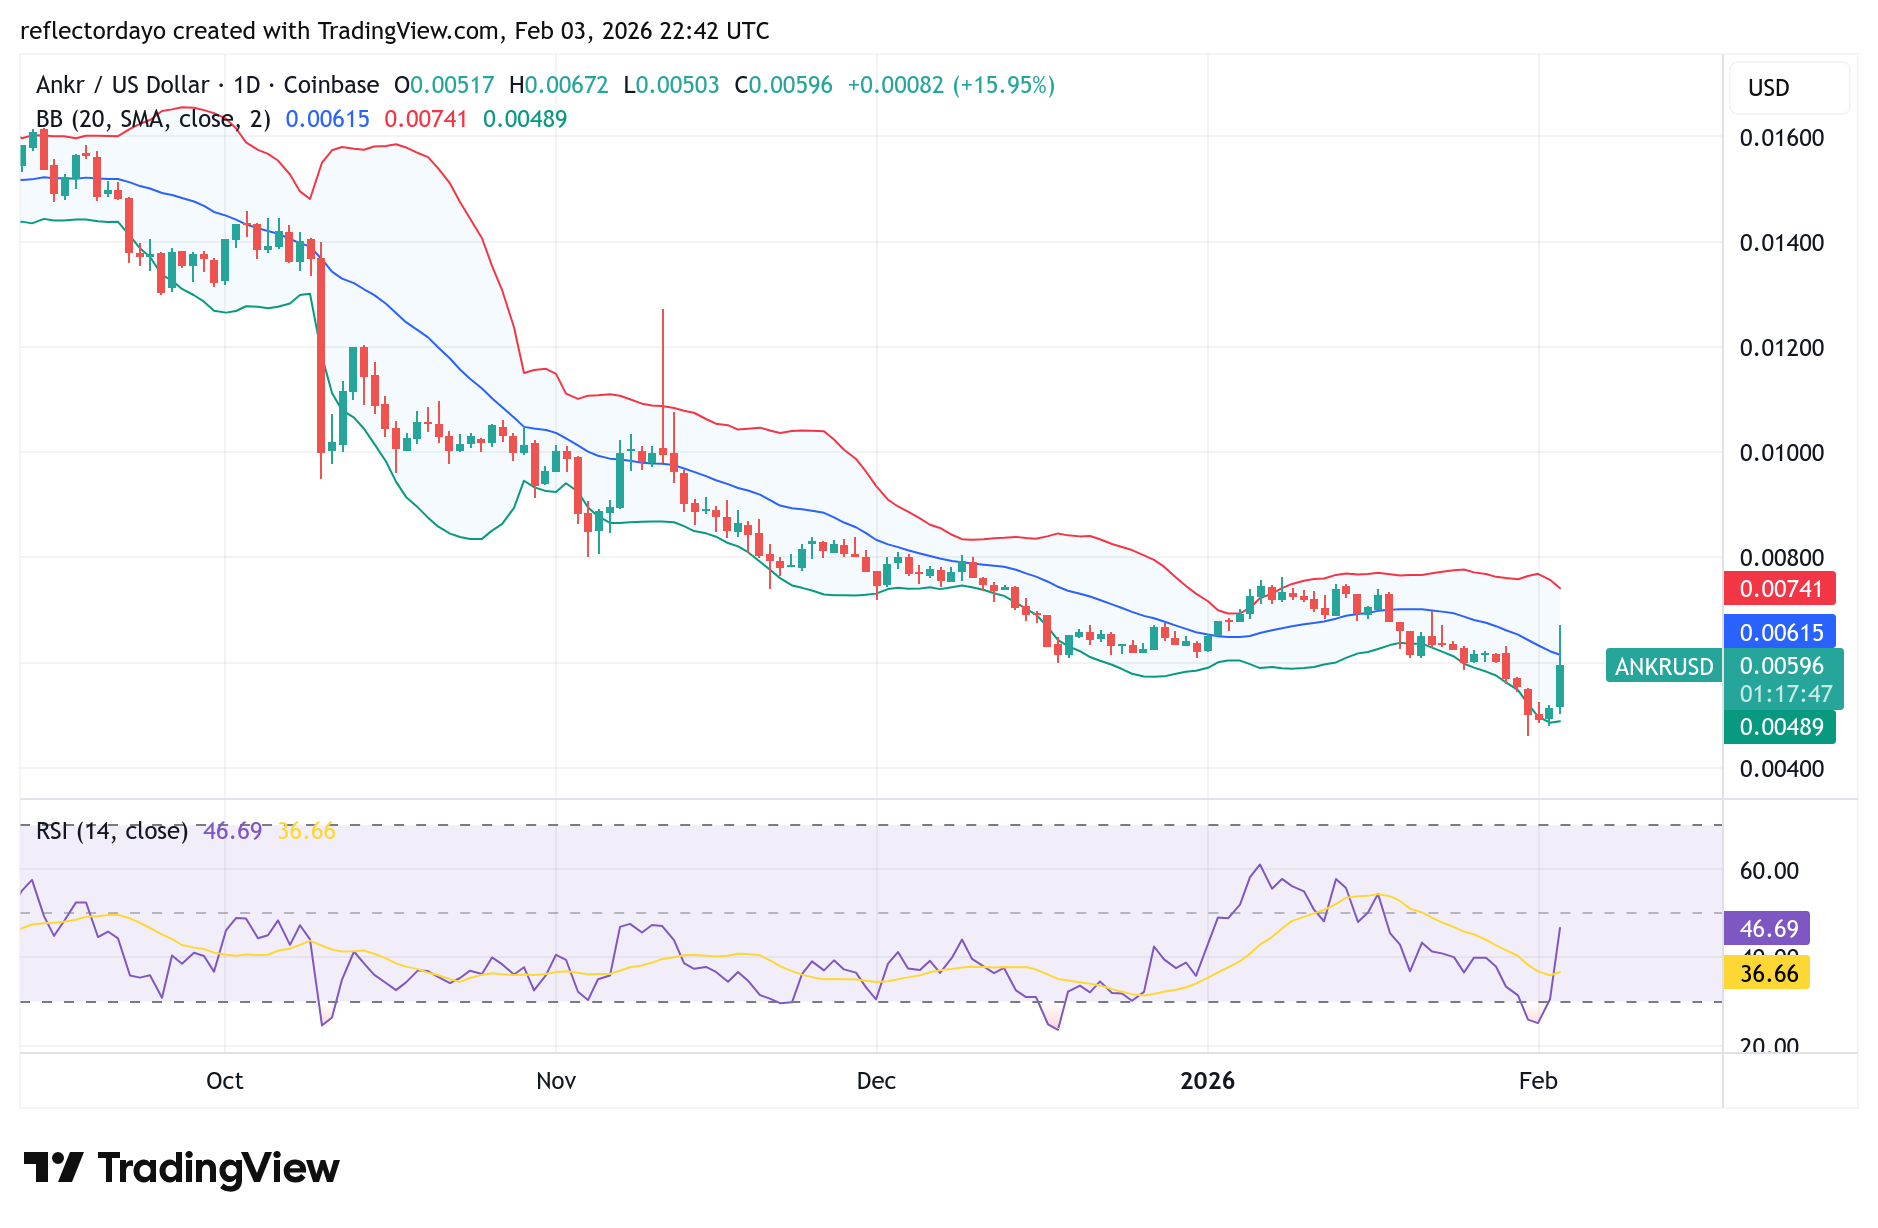
The Ankr (ANKR/USD) market has remained in a bearish trend since November last year, following a breakdown below the key $0.01 price level. This level initially attracted strong participation from both buyers and sellers, leading to elevated volatility. However, bearish pressure ultimately dominated, forcing the market lower.
As the decline progressed, downside momentum began to fade, with volatility dropping significantly—an early sign that selling pressure was weakening. Near the $0.006 price area, the market showed mild bullish bias, resulting in a consolidation phase that hinted at possible trend exhaustion.
In today’s trading session, The Ankr market confirmed this shift in sentiment with a decisive bullish breakout of approximately 3.8%, signaling renewed buying interest and the potential start of a recovery phase. Sustained upside momentum could allow the market to challenge nearby resistance levels, while failure to hold above the breakout zone may lead to further consolidation.
Ankr (ANKR/USD) Market Data
- ANKR/USD Price Now: $0.06
- ANKR/USD Market Capitalization: 50.9 million
- ANKR/USD Circulating Supply: 10 billion ANKR
- ANKR/USD Total Supply: 10 billion ANKR
- ANKR/USD CoinMarketCap Ranking: #388
ANKR/USD Remains Range-Bound as Early Recovery Signals Emerge
ANKR/USD continues to trade within a well-defined price channel that has remained intact since the formation of a notable weekly candle marked by a long upper wick. During that move, price briefly surged toward the $0.025 area before retreating and settling near $0.018, where consolidation has since dominated price action. Notably, ANKR has yet to produce a decisive wick outside this channel, highlighting persistent range-bound conditions.
Despite the broader consolidation, the market recently posted a short-term rally of approximately 13%, signaling renewed buying interest at historically low price levels. However, upside progress remains capped by multiple higher-timeframe resistance zones, particularly on the monthly chart, which continue to limit bullish expansion.
From a structural standpoint, a confirmed breakout above the channel would expose ANKR to a potential advance toward the $0.023 region. Volume dynamics, however, remain a key hurdle. Price is still trading well below the volume point of control, with a more constructive market structure likely requiring a sustained move above the $0.026–$0.027 range. A broader shift in participation could emerge if price successfully reclaims the $0.03 level.
Momentum indicators are beginning to show early signs of recovery, with oscillators gradually lifting from oversold conditions and bearish momentum fading. That said, mid-term timeframes still suggest the need for further consolidation before a stronger bullish continuation can be confirmed.
Key Levels to Monitor
- Resistance: $0.065, $0.070, $0.075
- Support: $0.045, $0.050, $0.055
Ankr Market Analysis: Technical Viewpoint
Perhaps this ongoing bullish recovery would have unfolded at the $0.06 price level under normal market conditions. However, the broader crypto market was recently hit by a wave of heightened downside volatility, which disrupted the recovery and forced prices lower. As a result, the current bullish rebound is now taking place below this critical level, with $0.06 acting as a key resistance zone, as bears have firmly taken control of this area.
ANKR Token Holders Play a Key Role in Network Governance
ANKR token holders are more than just participants in the market—they are active stakeholders in the Ankr ecosystem. Holding ANKR grants governance rights, allowing users to vote on key protocol upgrades and decisions that shape the future of the network. This governance model places decision-making power directly in the hands of the community, reinforcing Ankr’s commitment to decentralized infrastructure and the broader vision of Web3 innovation driven by collective participation.
1/4:
Do you hold ANKR?
You hold power. Token holders get exclusive voting rights on protocol upgrades.
Your voice matters in shaping Web3 infrastructure.
Democracy meets blockchain innovation! 🗳️#Ankr
A thread: pic.twitter.com/rTgxYrCJeI
— da crypto guy (@obedonchain) February 3, 2026
Technical ViewPoint (Continued)
The true test of the ongoing bullish recovery lies in whether price can reclaim and sustain a move above the $0.06 resistance level. For now, however, that possibility remains under pressure, as the market continues to face strong selling interest around this zone.
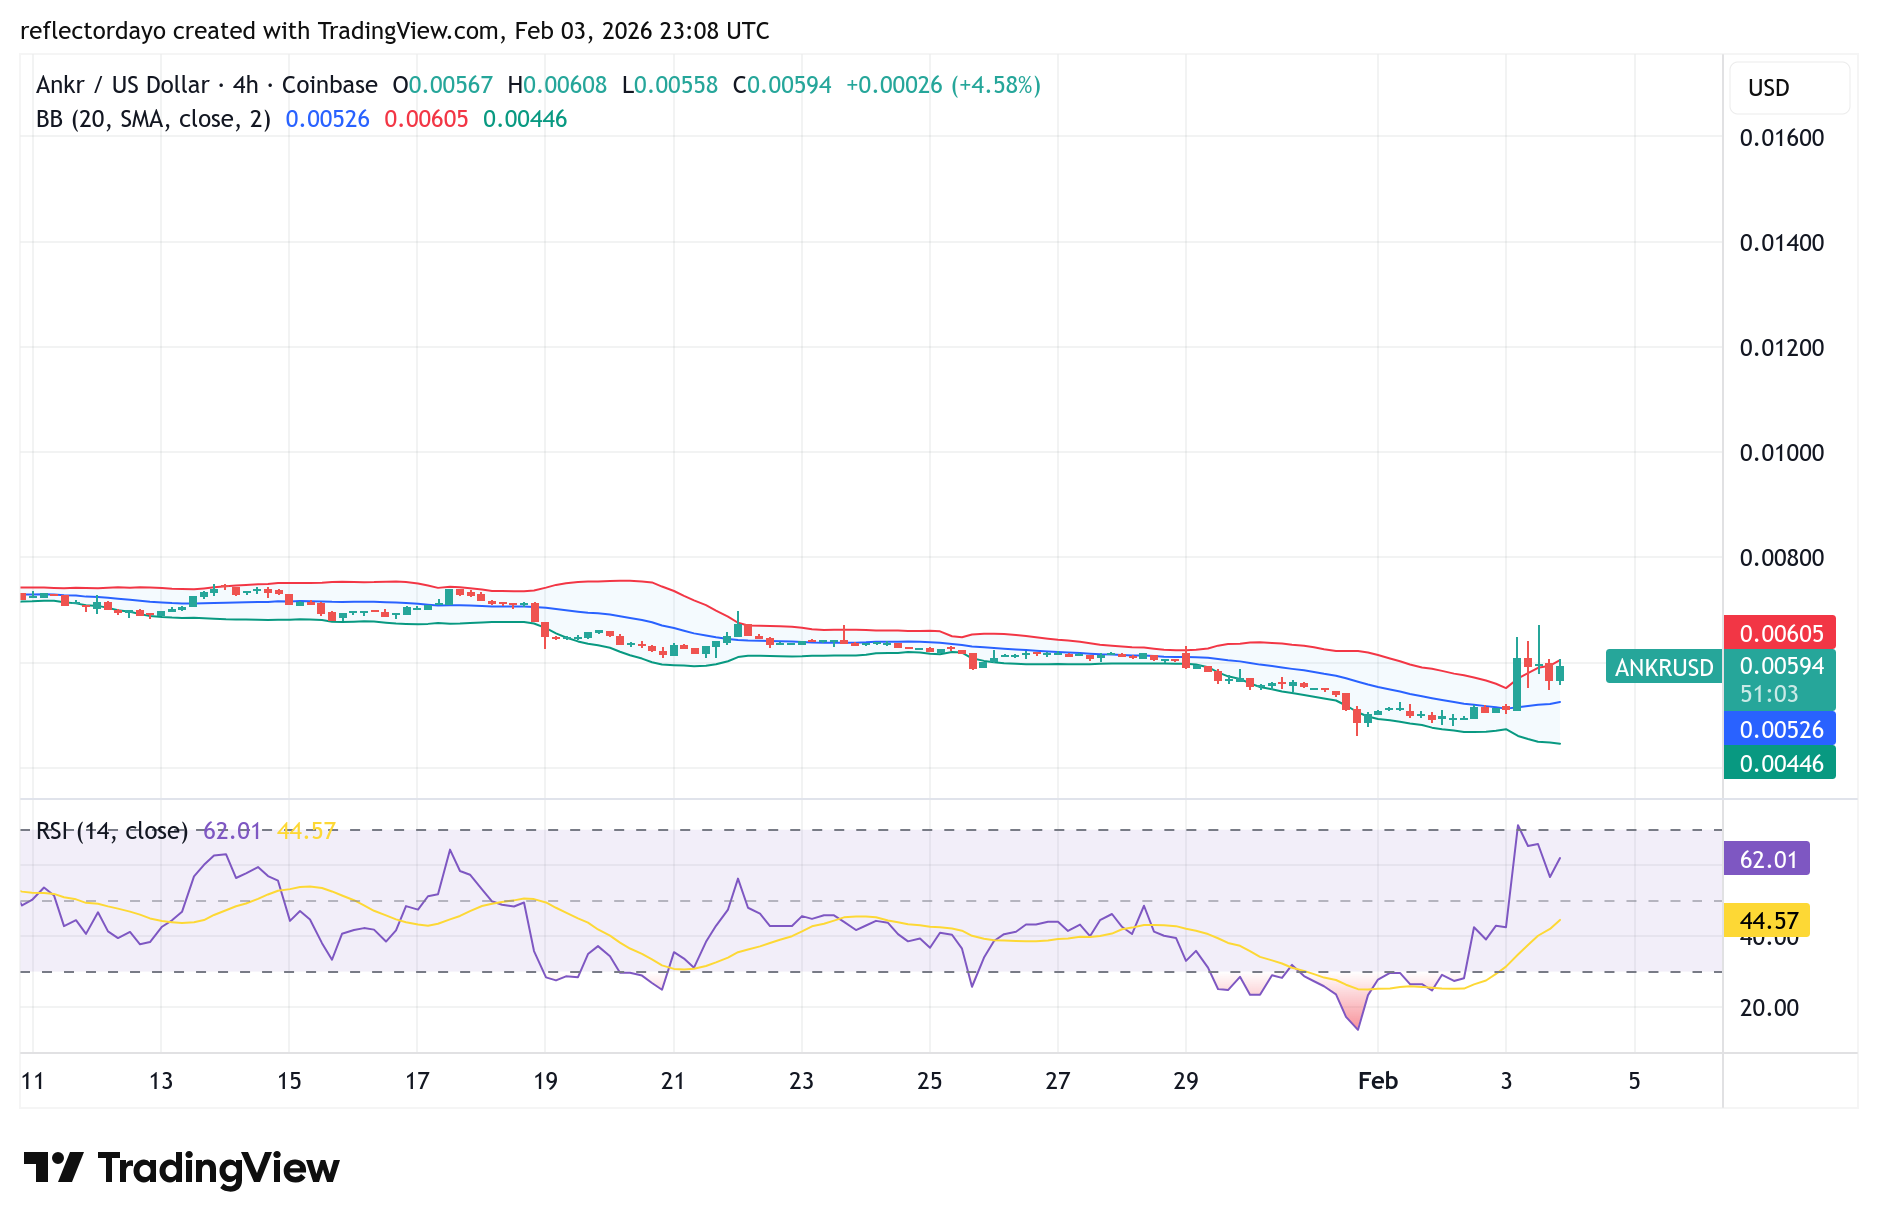
ANKR/USD 4-Hour Chart Outlook
When the market is viewed on the 4-hour chart, a clear struggle between demand and supply emerges around the $0.06 price level. Price action is actively fluctuating around this zone, highlighting its importance as a near-term decision point. This behavior suggests that neither bulls nor bears have gained full control, and the battle for dominance at this level remains ongoing.
Amid this uncertainty, traders should closely monitor whether the market can sustain a move above the $0.06 level, as a successful hold above this zone would help confirm the strength and continuation of the bullish recovery.