Apecoin (APE/USD) Turns in the Bullish Direction after Hitting $1.874
Estimated Reading Time: 2 minutes
Don’t invest unless you’re prepared to lose all the money you invest. This is a high-risk investment and you are unlikely to be protected if something goes wrong. Take 2 minutes to learn more
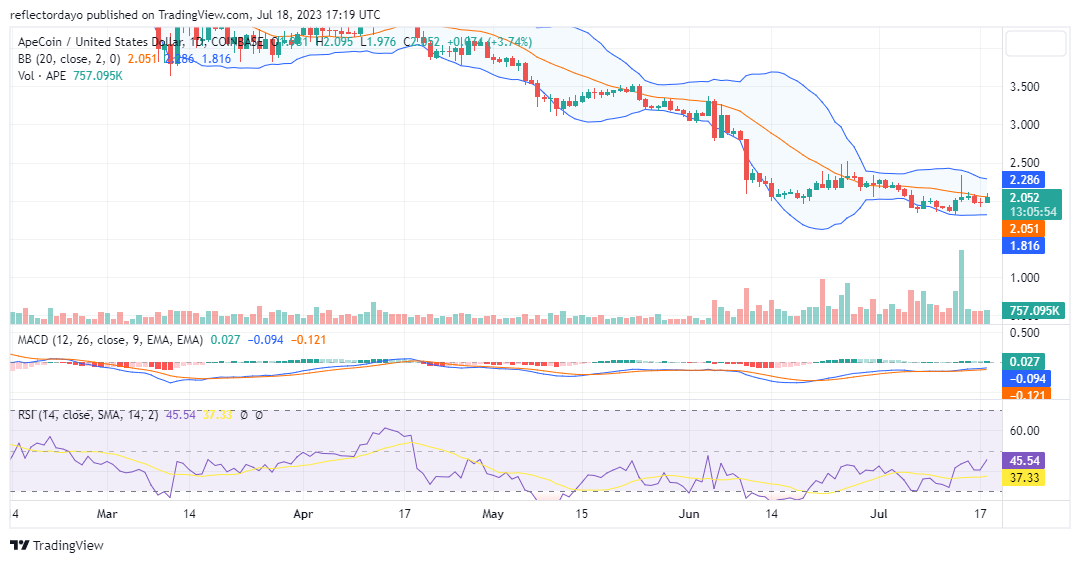
The Apecoin market has been in a downtrend since April, But now it seems like the bear market has hit a brick wall, as we can see from the appearance of the inverted hammer candlestick pattern. There has been a prolonged period of sell-off, so the appearance of this type of candlestick pattern may suggest that bulls are gaining strength to turn the market around in their favor.
Apecoin Market Data
- APE/USD Price Now: $2.06
- APE/USD Market Cap: $758,349,313
- APE/USD Circulating Supply: 368,593,750 APE
- APE/USD Total Supply: 1,000,000,000
- APE/USD CoinMarketCap Ranking: #54
Key Levels
- Resistance: $2.30, $3.00, and $3.50.
- Support: $1.90, $1.50, and $1.30.
Price Prediction for Apecoin: The Indicators’ Point of View
The appearance of an inverted hammer and a very significant volume histogram on July 14 is a sign of a potential trend reversal. The strong volume indicates a significant influx of Apecoin buyers, but the inability to push the price higher indicates a lack of follow-through momentum. Traders might view this as a potential sign of a trend slowdown or a period of consolidation, but it also stands as a sign of a trend reversal.
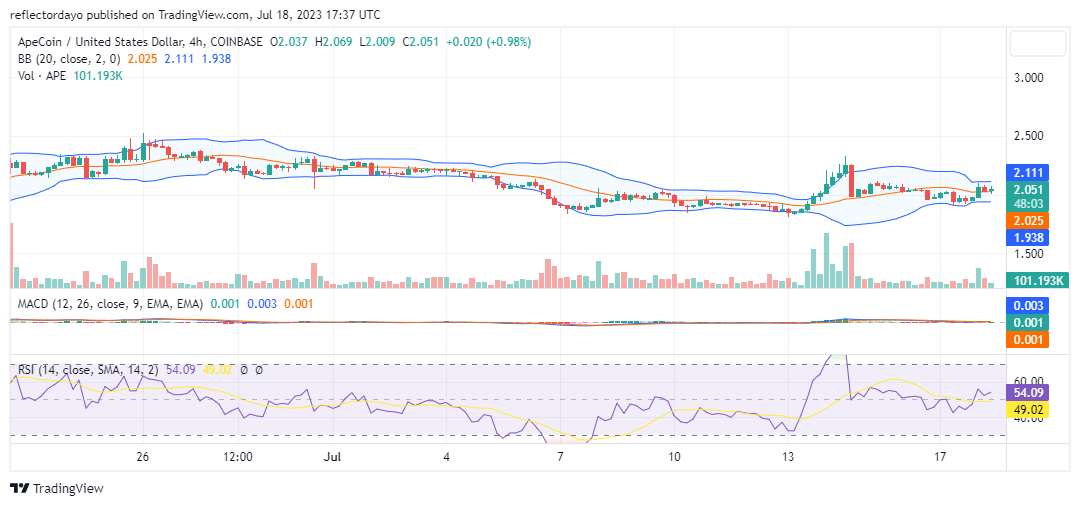
APE/USD 4-Hour Chart Outlook
In the 4-hour timeframe, the market is moving along with the 20-day moving average. This means that the price is still within the range of equilibrium, even though demand slightly exceeds supply. The bulls need to overcome the key resistance at $2.269. However, as the Bollinger Bands indicator suggests a decrease in volatility, we might witness some price consolidation before a significant movement occurs.