Arbitrum (ARB/USD) Breaks the $1.200 Resistance Price Level
Estimated Reading Time: 3 minutes
Don’t invest unless you’re prepared to lose all the money you invest. This is a high-risk investment and you are unlikely to be protected if something goes wrong. Take 2 minutes to learn more
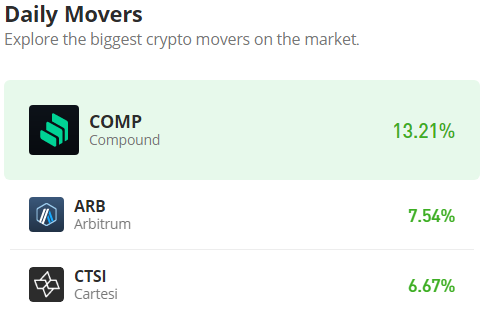
The Arbitrum market featured in yesterday’s daily market movers, gaining by 3.17% but being faced with the $1.200 barrier. Today, the price of Arbitrum has surpassed the price barrier at the $1.200 level. In addition, price action has made more progress and is currently looking for a higher price resistance level.
However, to fully claim a space in this new price zone, bulls need to secure a strong base, which will be above the crucial price level of $1.200. This will ensure the continuation of the bullish movement.
Arbitrum Market Data
- ARB/USD Price Now: $1.219
- ARB/USD Market Cap: $2,000,000,000
- ARB/USD Circulating Supply: 1,275,000,000 ARB
- ARB/USD Total Supply: 10,000,000,000
- ARB/USD CoinMarketCap Ranking: #35
Key Levels
- Resistance: $1.700, $1.200, and $1.500
- Support: $1.050, $1.000, and $0.900.
Price Prediction for Arbitrum: The Indicators’ Point of View
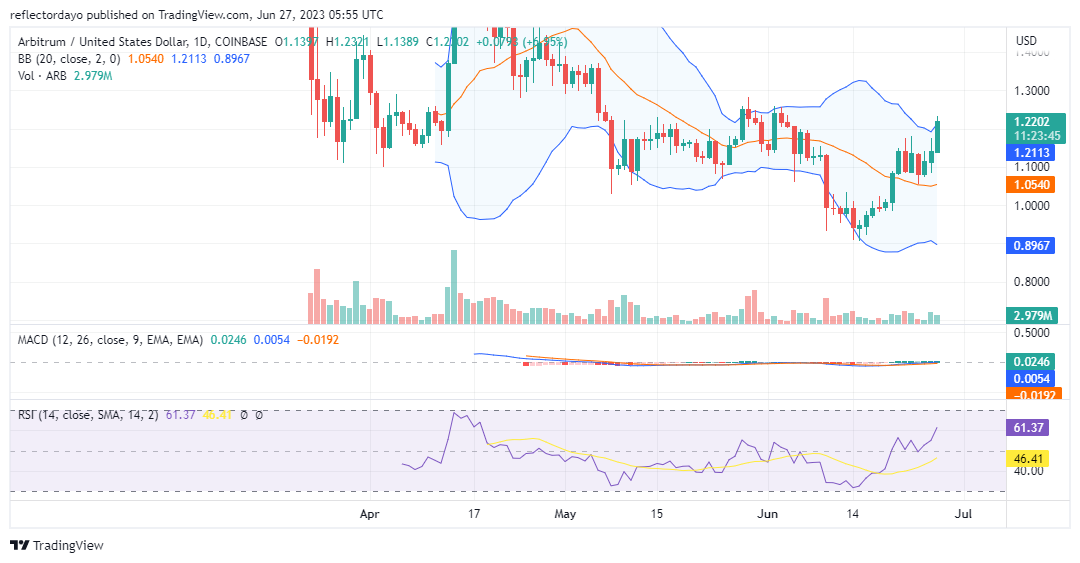
After breaking the $1.200 resistance price level, the Arbitrum market seems to be gaining momentum as it pumps and reaches higher price levels above the crucial price mark. However, bears have not gone too far, even though the buying pressure has forced them to shift ground; traders are still bearishly biased around the $1.1327 price level.
Another source of concern is the high level of volatility in the market. The high level of volatility can have a double-edged effect because it loosens up the market in such a way that bears can also be formidable at this time. But for now, the Relative Strength Index (RSI) shows that the bullish momentum is very high, as the line measures 61.18. The Arbitrum bears, however, appear weak, and the volatility of the market appears, for now, to be one-sided.
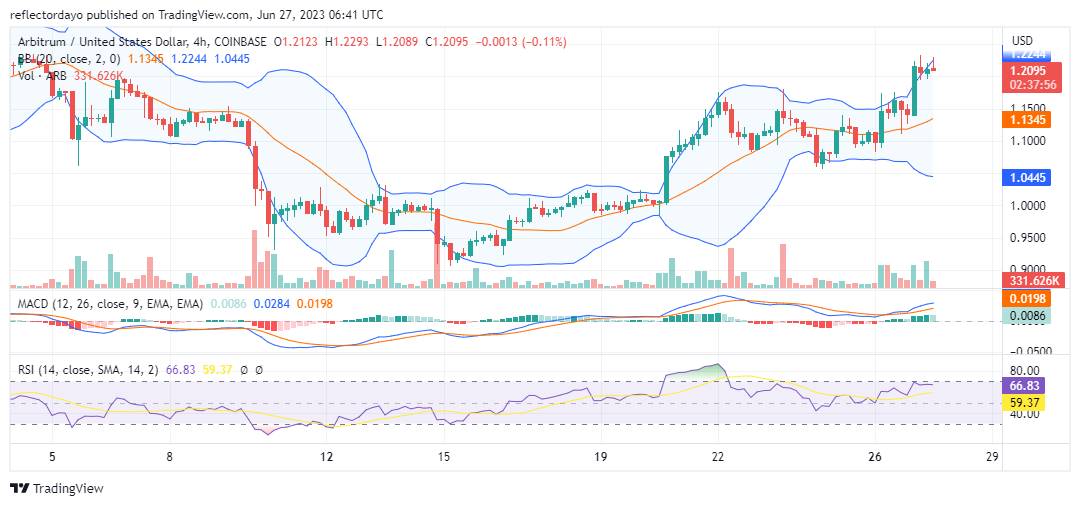
ARB/USD 4-Hour Chart Outlook
In the very first 4-hour trading session, bulls almost completely dominated the market, as the strong bullish move peaked at the $1.2252 price level. But in the subsequent trading session, we noticed a bearish divergence as the volume of trade did not commensurate with the actual candlestick representing activities within the session. The histogram representing the volume of trade appears very strong, but the candlestick appears small, showing that the market did not have much movement within the trading session.
This is a sign that bears might be becoming stronger, and a trend reversal is possible if bulls do not establish support above the $1.200 price level. Also, the market portrayed in the Relative Strength Index is at the edge of overbought; this might also scare bulls away for now. But if they continue pushing the market, bears will have to shift to the $1.300 supply zone.