Arbitrum (ARBUSD) Crosses Into the Bullish Territory
Estimated Reading Time: 2 minutes
Don’t invest unless you’re prepared to lose all the money you invest. This is a high-risk investment and you are unlikely to be protected if something goes wrong. Take 2 minutes to learn more
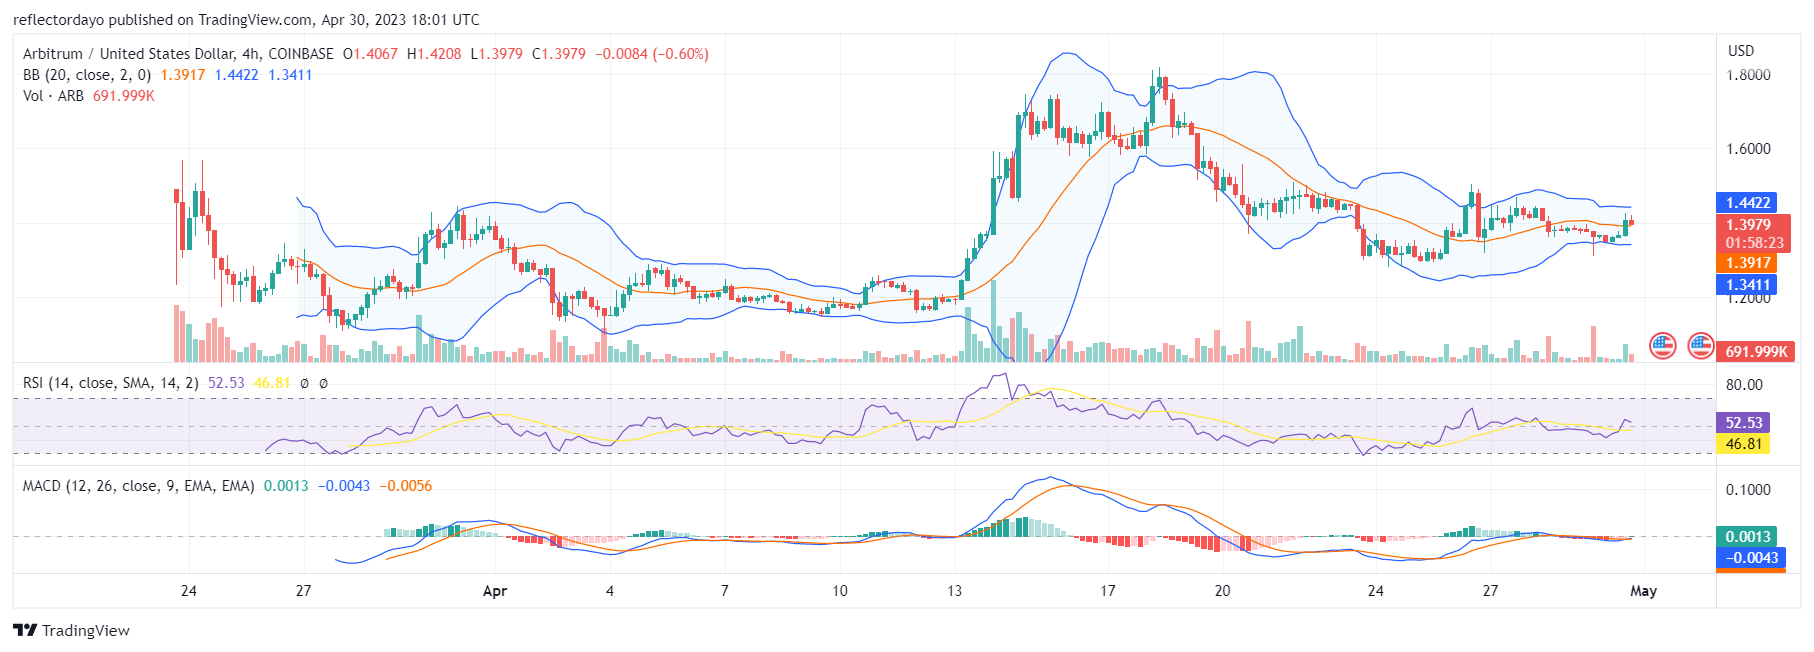
Currently, the Arbitrum market is on the trail to the $1.44 price level. This is a major resistance level that has repeatedly prevented the progress of the bull market. This resistance level is also the basis for the bearish movement that brought the price below the $1.40 price level. It seems like traders are mostly bullish about this market, even though it is a newcomer to the crypto industry.
ARB/USD Price Statistics
- ARB/USD Price Now: $1.413
- ARB/USD Market Cap: $270,436,820
- ARB/USD Circulating Supply:1,275,000,000
- ARB/USD Total Supply: 10,000,000,000
- ARB/USD CoinMarketCap Ranking: #38
Key Levels
- Resistance: $1.44, $1.45, and $1.50
- Support: $1.35, $1.30, and $1.25
Price Prediction for Arbitrum: The Indicators’ Point of View
The Arbitrum market is new in the industry, and that is why we are going to base our analysis on a 4-hour chart. The Arbitrum market started on March 23 and has hit an all-time high of $1.800. After reaching the high $1.800 price level, the bear market was activated, and we saw a very significant bearish cycle. Despite the significant bear market, the bull market was still salvaged at the $1.30 price level. If the bullish price was conserved at this level, the next stop would have been the $1.15 price level. Looking at the Relative Strength Index (RSI), it looks like the $1.44 price level is a strong psychological level as strong selling activities gather momentum from this level. The RSI line measures the momentum of the bull market at level 54, and the pressure of the key resistance seems to be pushing the market backward.
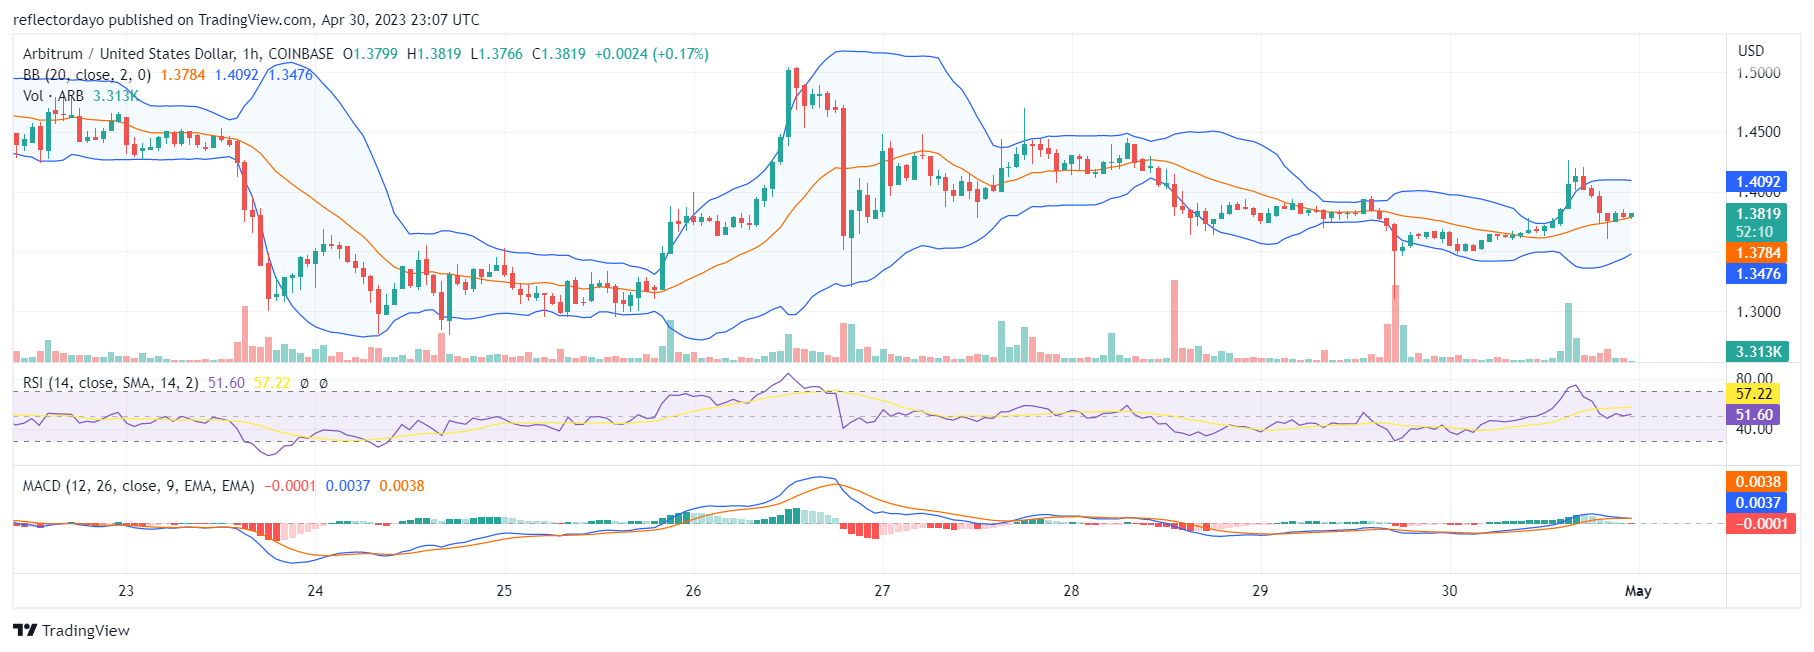
ARB/USD 1-Hour Chart Outlook:
On the 1-hour outlook, we are seeing a price retracement after the market entered the overbought region. The buyers need to quickly secure a support level nearby so as to prevent the formation of another lower high after the one that formed at $1.44. Perhaps, the $1.400 price level could be the new higher support level. Apart from the fact that Bollinger Bands indicate a very significant explosion in the volatility of the market, all the indicators are still bullishly biased.