Bancor (BNT/USD) Poised for a Breakout to Reach Elevated Price Levels
Estimated Reading Time: 3 minutes
Don’t invest unless you’re prepared to lose all the money you invest. This is a high-risk investment and you are unlikely to be protected if something goes wrong. Take 2 minutes to learn more
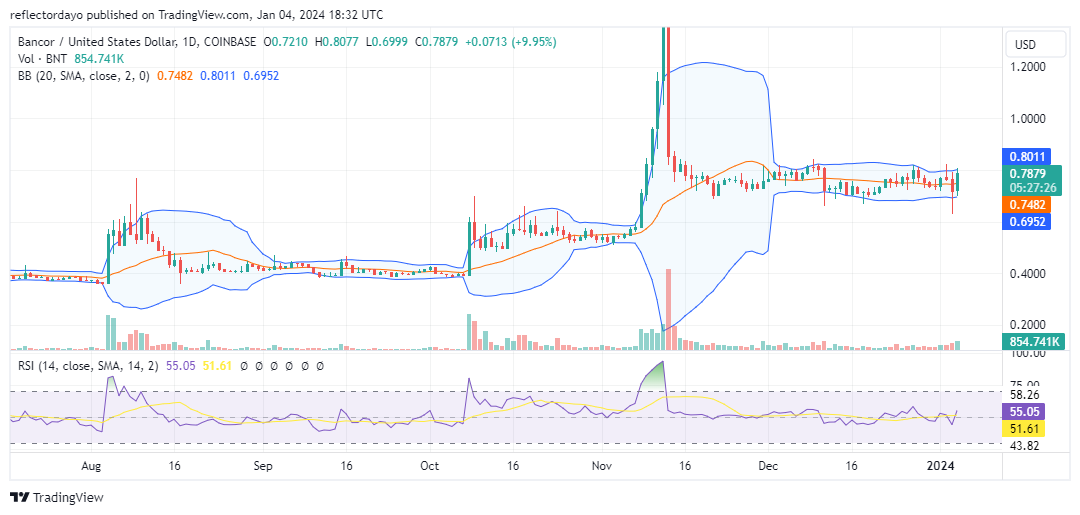
On the first of November last year, the Bancor market witnessed a significant price surge within a few days. This bullish momentum propelled the market from approximately $0.54 to a peak near $2.00, specifically reaching $1.950. While such a hyper-bullish movement typically anticipates substantial profit-taking, which could potentially reverse the gains and initiate a bearish trend, traders stepped in to buy around the $0.75 mark. This established a firmer support level above the previous $0.50 mark. Subsequently, the market has consolidated around the $0.75 price level since early December.
Bancor Market Data
- BNT/USD Price Now: $0.7899
- BNT/USD Market Cap: $107,713,616
- BNT/USD Circulating Supply: 134,503,274 BNT
- BNT/USD Total Supply: 161,196,921 BNT
- BNT/USD CoinMarketCap Ranking: #342
Key Levels
- Resistance: $0.85, $0.90, and $1.00.
- Support: $0.72, $0.68, and $0.60.
Bancor Market Forecast: Analyzing the Indicators
In November, a pronounced bullish movement, fueled by substantial profit-taking following a strong price surge, seemed to decelerate the typical bullish momentum observed in the cryptocurrency market as 2023 drew to a close. The Bollinger Bands indicated heightened volatility, as evidenced by their expanded width. Nonetheless, the trade volume indicator sounded a note of caution, with its histogram not entirely corroborating the sharp price ascent. Despite the rapid ascent to $2.00, trading volume data suggests a potential limitation in the number of traders propelling this trend, hinting at possible heightened bullish sentiment.
During today’s trading session, the Bancor market appears to align more favorably with bullish sentiments, suggesting an imminent break in the prevailing consolidation pattern. While today’s trade volume histogram exhibits notable height, it doesn’t fully align with the robust bullish candlestick representing the day’s market activity. Nevertheless, the upper standard deviation curve is starting to reflect the market’s bullish undertone.
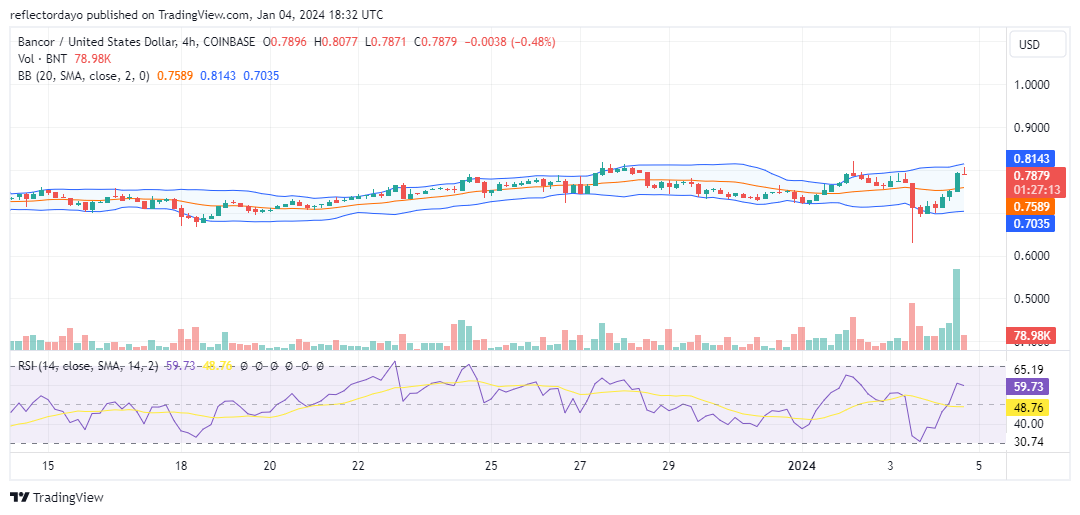
SKL/USD 4-Hour Chart Outlook
Upon examining the 4-hour chart, a timeframe of shorter duration, we observe a pronounced bearish resistance near the $0.800 price level. The market displays candlesticks that closely resemble a gravestone doji within the current 4-hour trading session, accompanied by a histogram of greater amplitude. These market dynamics indicate a significant tug-of-war between demand and supply at this pivotal resistance level. However, given that the present histogram registers a smaller magnitude than its predecessor, it appears unlikely that the bullish momentum will surpass this resistance. Nonetheless, traders should remain vigilant for a potential breach of the $0.800 resistance level, as such a development would validate the anticipated bullish trajectory.