Binance Coin Falls Significantly as It Revisits the $260 Low
Estimated Reading Time: 3 minutes
Don’t invest unless you’re prepared to lose all the money you invest. This is a high-risk investment and you are unlikely to be protected if something goes wrong. Take 2 minutes to learn more
Binance Coin (BNB) Long-Term Analysis: Bullish
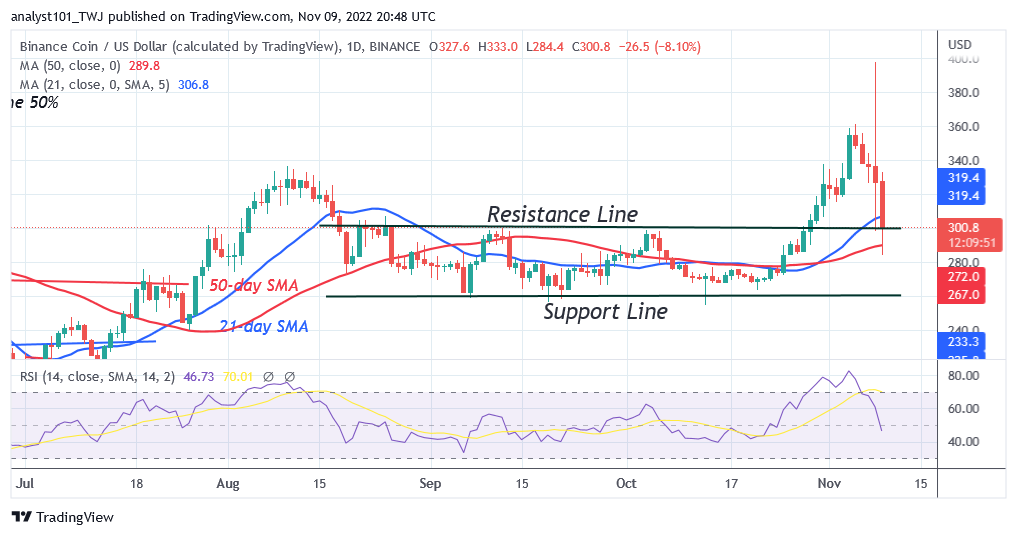
Binance Coin (BNB) price has recently retraced above the $306 breakthrough mark as it revisits the $260 low. The cryptocurrency’s price bounced back during the last price action and crossed the overhead barrier at $336. BCH has reached highs between $360 and $400 thanks to the breaching of the overhead resistance. As the altcoin found support above the moving average lines today, the bullish impetus was resisted. As the altcoin fluctuates above the moving average lines, the selling pressure has decreased. If the current support holds, BNB will revisit the overhead resistance at $336. If price breaches below the moving average lines, selling pressure will pick up again. BNB will subsequently decline below the $300 breakthrough mark. Today’s price is below the $306 support.
Binance Coin (BNB) Indicator Analysis
BNB is at level 46 of the Relative Strength Index for period 14. The crypto’s price is in a downtrend zone and could continue to fall. As long as the price bars remain between the moving average lines, the cryptocurrency may resume its sideways movement. Additionally, a lateral trend is indicated by the horizontal sloping of the moving averages. The daily Stochastic’s level 20 is below the BNB price. It suggests that the coin has entered an oversold area.
Technical indicators:
Major Resistance Levels – $440, $460, $480
Major Support Levels – $240, $220, $200
What Is the Next Direction for Binance Coin (BNB)?
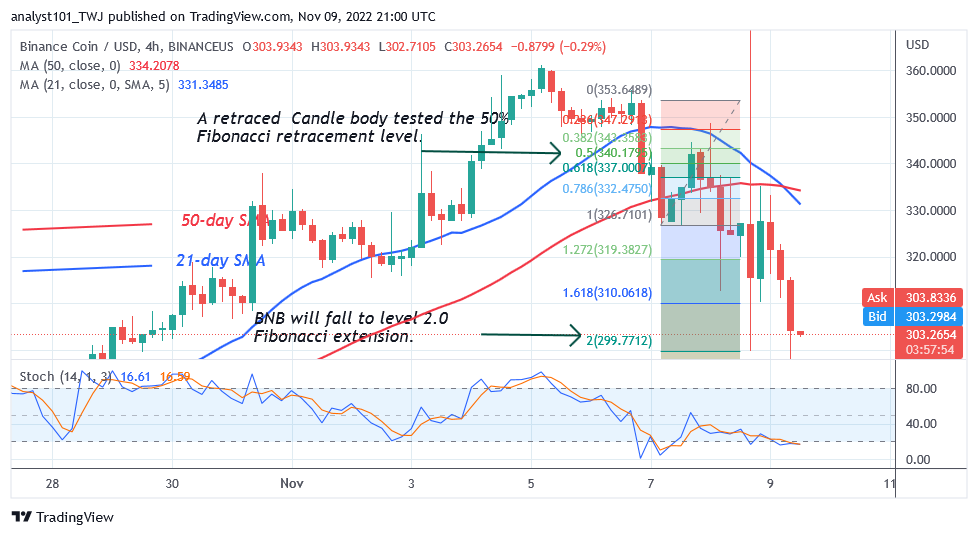
On the 4-hour chart, Binance Coin has experienced a substantial decline as it revisits the $260 low. The altcoin has deviated below the lines of the moving average lines. BNB price corrected upward during the decline of November 7 and a candle body tested the 61.8% Fibonacci retracement level. The correction predicts that BNB will fall to level 1.618 of the Fibonacci extension, or $310.06. According to price movement, the market has fallen to a low of $287.81.
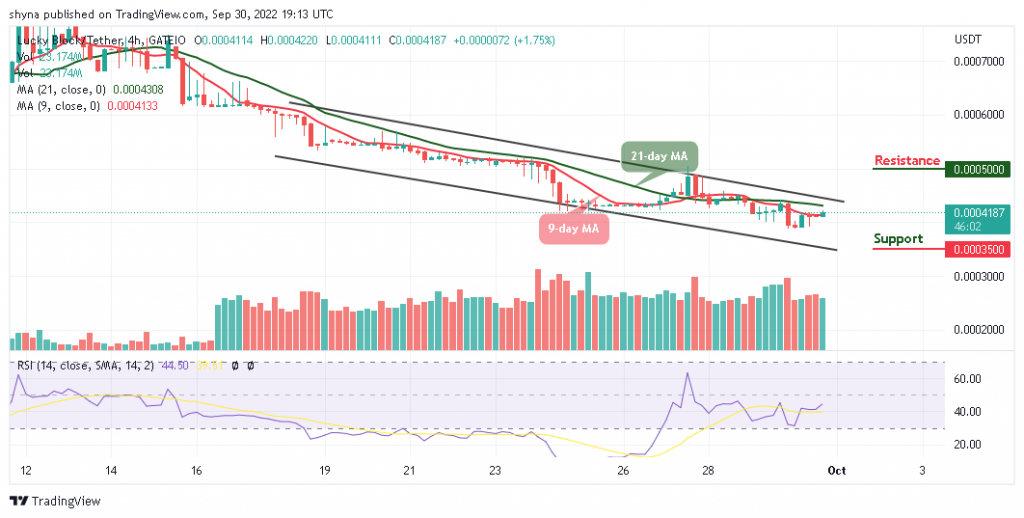
You can purchase crypto coins here. Buy LBLOCK
Note: Cryptosignals.org is not a financial advisor. Do your research before investing your funds in any financial asset or presented product or event. We are not responsible for your investing results