Bitcoin (BTC) Price Prediction: BTC/USDT Resumes Its Decline
Estimated Reading Time: 2 minutes
Don’t invest unless you’re prepared to lose all the money you invest. This is a high-risk investment and you are unlikely to be protected if something goes wrong. Take 2 minutes to learn more

Date: February 11, 2026
Price action in the Bitcoin market has been facing strong headwinds for several weeks. At this point, bearish forces are expected to remain dominant and continue pressuring prices lower.
BTC/USDT Long-Term Trend — Bearish (Daily Chart)
Key Price Levels
Resistance: $69,000, $72,000, $74,500
Support: $66,000, $65,000, $63,000
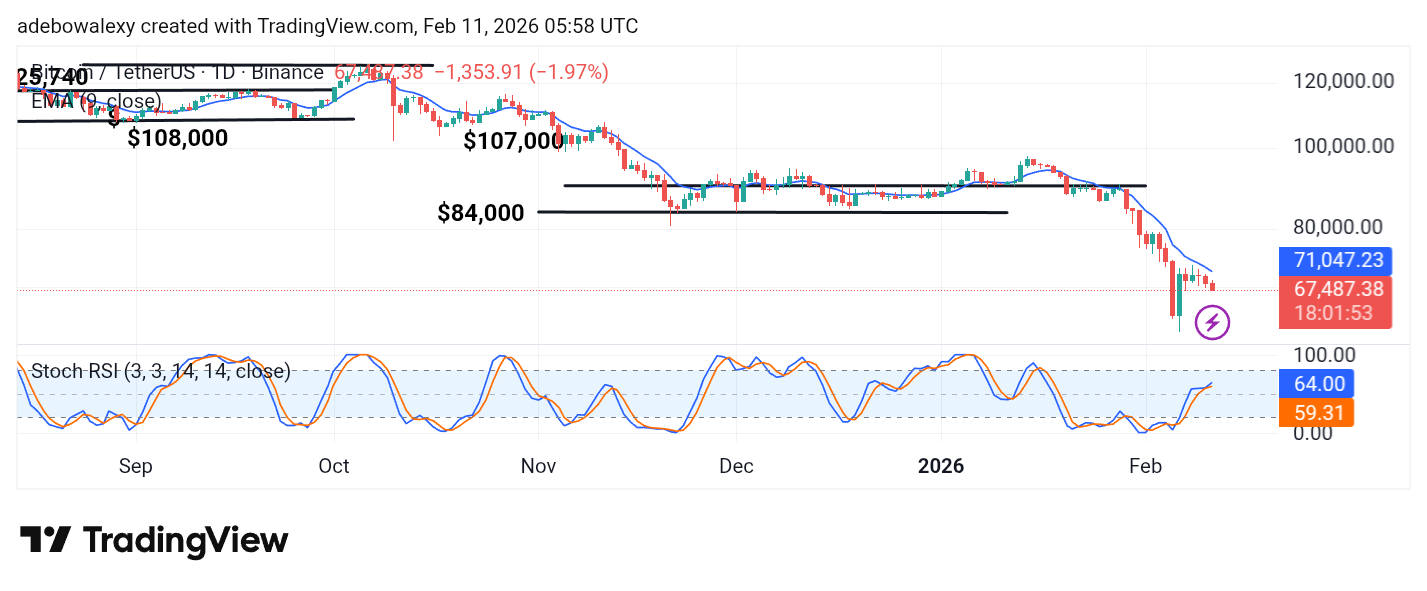
The Bitcoin market has recorded another downward dip in the ongoing session. The current session is represented by a red price candle trading below the 9-day Exponential Moving Average (EMA). Meanwhile, the Stochastic Relative Strength Index (SRSI) lines can be seen rising upward after aborting a previous downward crossover above the 50 threshold level.
Bitcoin Price Prediction: BTC/USDT Shows Mixed Indications on the Daily Chart
Although the Bitcoin market maintains a clear downward trajectory on the price chart, there are some signals that contradict this outlook. For nearly two weeks, price action in the BTC/USDT market has remained below the 9-day EMA curve. The ongoing session has dipped further while still trading beneath this indicator.
However, the SRSI lines are pointing upward even as price action continues along a bearish path. This creates some confusion in the technical outlook. Nevertheless, the market’s EMA positioning remains predisposed toward further declines.
Bitcoin Price Prediction: BTC/USDT Bearish Bias Remains Intact (4-Hour Chart)
The Bitcoin 4-hour chart mirrors the trajectory seen on the daily timeframe. This consistency suggests that bearish momentum may still strengthen in the near term. The current session remains bearish and continues to trade below the 9-day EMA curve.
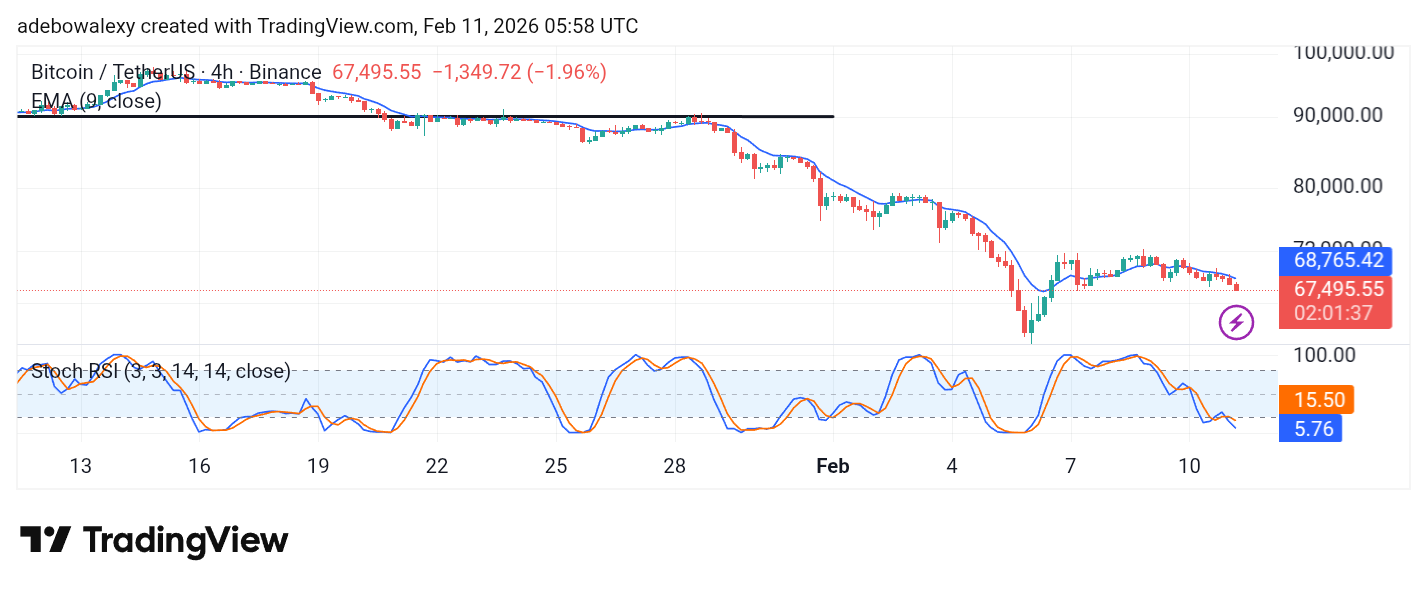
Unlike the daily chart, the SRSI lines on the 4-hour timeframe are descending toward the lower threshold in the oversold region. As a result, the bearish outlook appears firm, with price action potentially testing the $67,000 and $66,000 levels soon. This will happen only if the trend stays protected.