Bitcoin (BTC) Price Prediction: BTC/USDT Sees a Positive Contraction
Estimated Reading Time: 3 minutes
Don’t invest unless you’re prepared to lose all the money you invest. This is a high-risk investment and you are unlikely to be protected if something goes wrong. Take 2 minutes to learn more
Bitcoin Price Prediction (March 4)
Although price action in the Bitcoin market remains largely subdued based on its current position, bulls are already initiating a noticeable and interesting comeback. Consequently, this market appears quite striking and calls for a more careful examination to identify trading opportunities.
BTC/USDT Long-Term Trend: Bearish (Daily Chart)
Key Price Levels:
Resistance: $90,000, $95,000, $100,000
Support: $85,000, $80,000, $75,000
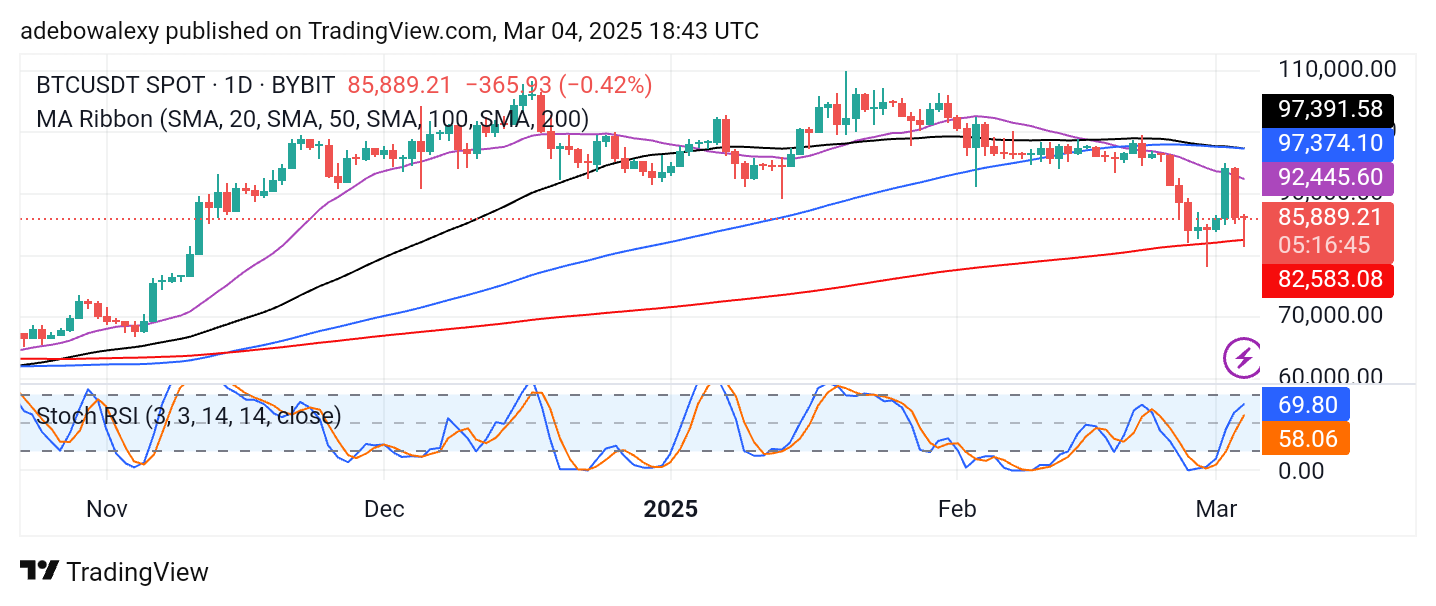
On the daily chart, price action remains below the 20-, 50-, and 100-day MA lines. However, the latest price candle appears to be contracting upward, resembling a hammer candle. Meanwhile, the Stochastic Relative Strength Index (RSI) indicator has been rising steadily over the previous sessions. However, the terminal of the indicator lines now appears more convergent than before.
Bitcoin Price Prediction: BTC/USDT Bears Are Being Pushed Back
The behavior of price activity in the Bitcoin daily market remains largely subdued, with the market trading below most MA lines. Nevertheless, the latest price candle on the chart is contracting upward after testing the last line of defense at the 200-day MA. This suggests that the 200-day MA is acting as a strong support level, prompting traders to re-enter the market.
The movement of the Stochastic RSI lines affirms notable buying activity, as the indicator lines rise from the oversold region. However, given the extension of these lines, the market may only present short-term gains.
Bitcoin Price Prediction: BTC/USDT Bullish Progress (4-Hour Chart)
On the 4-hour chart, BTC continues to trade below all MA lines. However, the ongoing session has recorded a significant upward retracement from support of around $82,500. At the same time, the Stochastic RSI lines have reached the depths of the oversold region. The terminals of these lines indicate that upward forces are already influencing price movement, as they are beginning to rise.
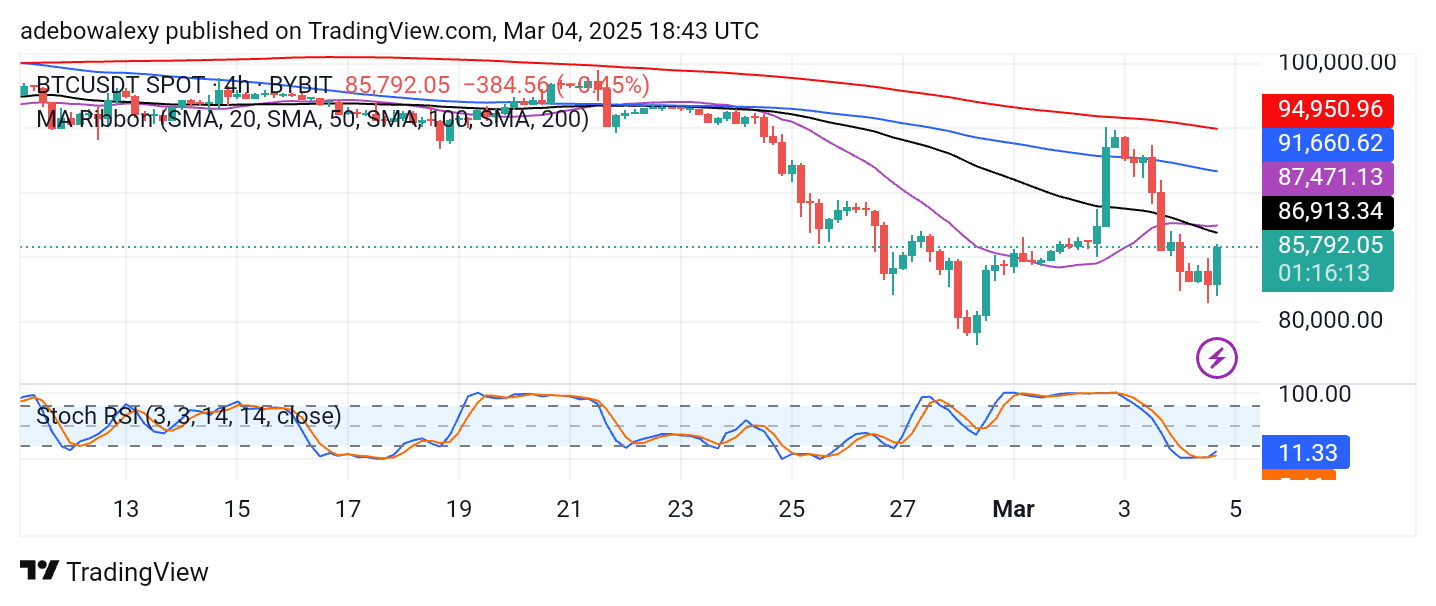
Technically, indicators suggest that price action may proceed toward higher levels. However, given that the market remains below all MA lines, the possibility of short-term gains is stronger. Consequently, targeting $92,000 may eventually prove to be a winning trade.