Litecoin (LTC) Price Prediction: LTC/USDT Dips Sharply
Estimated Reading Time: 3 minutes
Don’t invest unless you’re prepared to lose all the money you invest. This is a high-risk investment and you are unlikely to be protected if something goes wrong. Take 2 minutes to learn more

Litecoin Price Prediction (March 3)
As expected, the Litecoin market closely tracks Bitcoin’s price movements. Consequently, this has led to a sharp price decline at a time when Bitcoin is experiencing volatility in both directions.
LTC/USDT Long-Term Trend: Bearish (Daily Chart)
Key Price Levels:
Resistance: $110, $120, $130
Support: $100, $90, $80
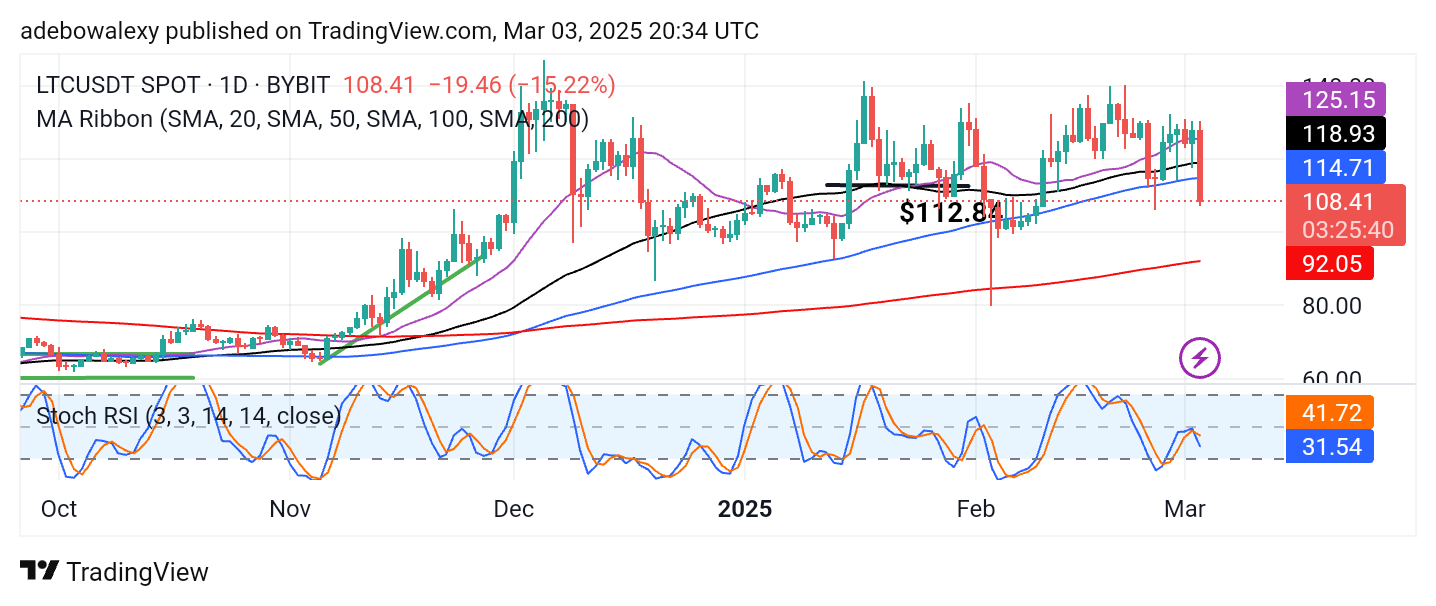
The Litecoin market has witnessed a sudden price decline at a time when price action appeared to have found support above all the Moving Average (MA) lines on the chart. The ongoing session has formed a long red price candle, plunging the market below three out of four MA lines. At the same time, the Stochastic Relative Strength Index (RSI) lines have just delivered a downward crossover below the 50 mark. However, prices seem to be falling more sharply than the RSI lines indicate following the crossover.
Litecoin Price Prediction: LTC/USDT Bears Are Quite Strong
The magnitude of the price decline in the ongoing session appears massive and unexpected. However, this is not surprising given that Bitcoin is currently experiencing significant volatility. This market dipped suddenly when price action seemed to have found support above the $120 price level.
Currently, price action sits above only the 200-day MA line, suggesting that an upward recovery is still possible but would require significant support from buyers. Meanwhile, the Stochastic RSI lines have just crossed downward below the 50 threshold. However, the indicator lines following the crossover are not well extended, signaling that downward pressure may still have a firm grip on this market.
Litecoin Price Prediction: LTC/USDT May Hit the $100 Mark (4-Hour Chart)
Even in the Litecoin 4-hour market, downward forces appear quite strong. Price action has been consistently declining for five consecutive sessions. The ongoing session has formed a small inverted hammer candle.
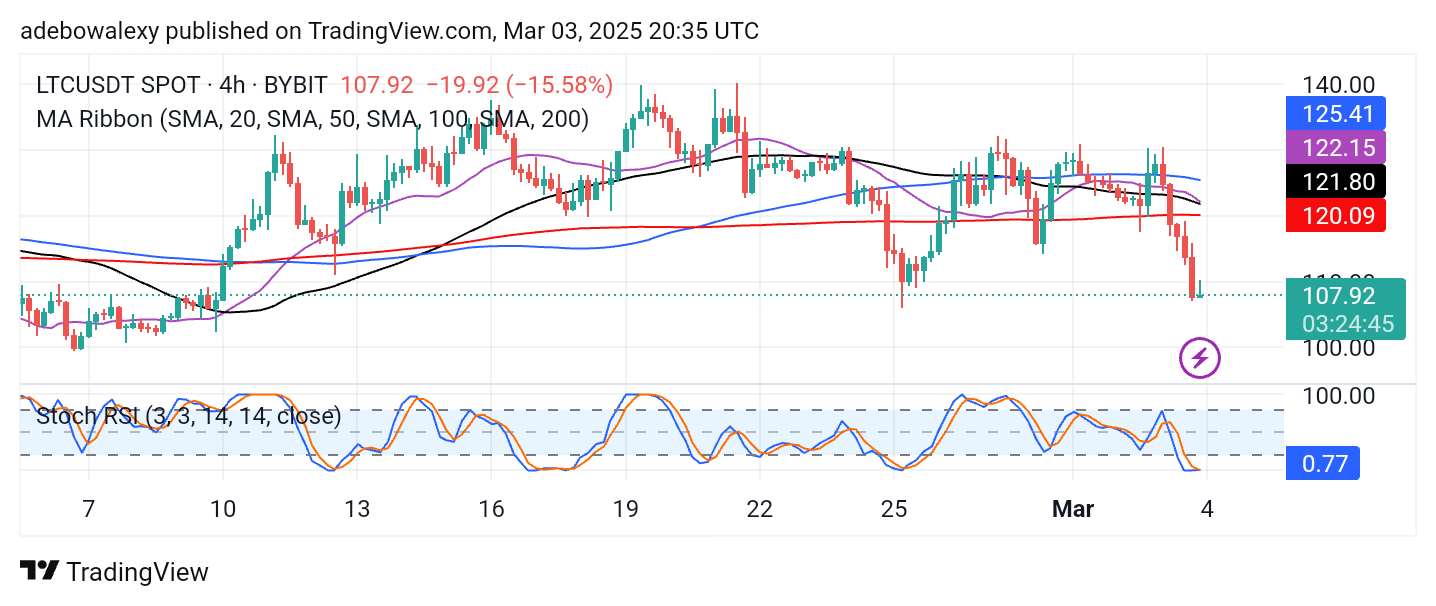
Additionally, price action has fallen below all MA lines. Meanwhile, the Stochastic RSI lines have dropped into the oversold region, merging and moving sideways at the 0.00 level.
By implication, the formation of the last price candle suggests a potential trend reversal. However, downward pressure still looks significant, considering that trading activity remains below all MA lines. Therefore, while price action could still fall toward the $105 and $100 levels, there remains a possibility that the market could rebound upwards.