Dogecoin (DOGE) Price Prediction: DOGE/USDT Stabilizes Above the $0.2000 Price Level
Estimated Reading Time: 3 minutes
Don’t invest unless you’re prepared to lose all the money you invest. This is a high-risk investment and you are unlikely to be protected if something goes wrong. Take 2 minutes to learn more

DOGE Price Prediction (March 3)
While Bitcoin briefly dipped strongly below the $80,000 price level, the Dogecoin market has managed to hold its ground above the $0.2000 level. However, price action is still facing a strong barrier formed by key technical indicators.
DOGE/USDT Long-Term Trend: Bearish (Daily Chart)
Key Price Levels:
Resistance: $0.2500, $0.3000, $0.3500
Support: $0.2000, $0.1500, $0.1000
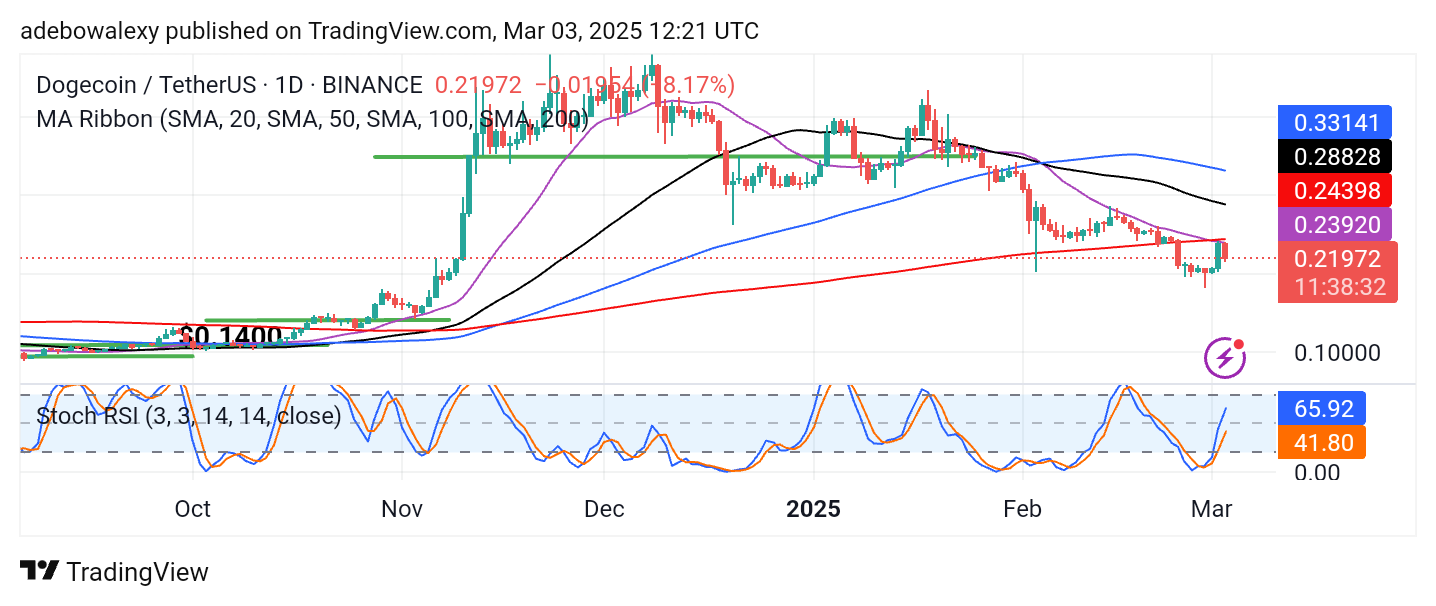
In the previous session, price action attempted to break through the resistance formed by the crossover between the 20- and 200-day Moving Average (MA) lines. However, this attempt failed, leading to a downward dip in the ongoing session. Despite this, price action remains above the $0.2000 level. Additionally, it should be noted that price activity remains below all the MA lines on the chart.
Dogecoin Price Prediction: $0.2000 Support Holds in the DOGE/USDT Market
Price activity in the Dogecoin market has rebounded off the intersection of the 20- and 200-day MA lines. This suggests that downward pressure is still strong, effectively blocking upward progress. The corresponding price candle for the ongoing session appears bearish.
Nevertheless, the last recorded price candle keeps the token’s value above $0.2000, precisely at $0.2197. Consequently, price action maintains an upward trajectory despite the rejection at higher levels. However, the movement of the RSI lines appears exaggerated compared to the magnitude of price increases in the market. This suggests that the market remains somewhat subdued and could still move lower.
Dogecoin Price Prediction: DOGE/USDT Shows Upside Potential (4-Hour Chart)
Examining the Dogecoin 4-hour chart, we can see that bullish forces are starting to assert themselves. The ongoing session has appeared green. Furthermore, the 20- and 50-day MA lines are now positioned below price action and can be seen converging.
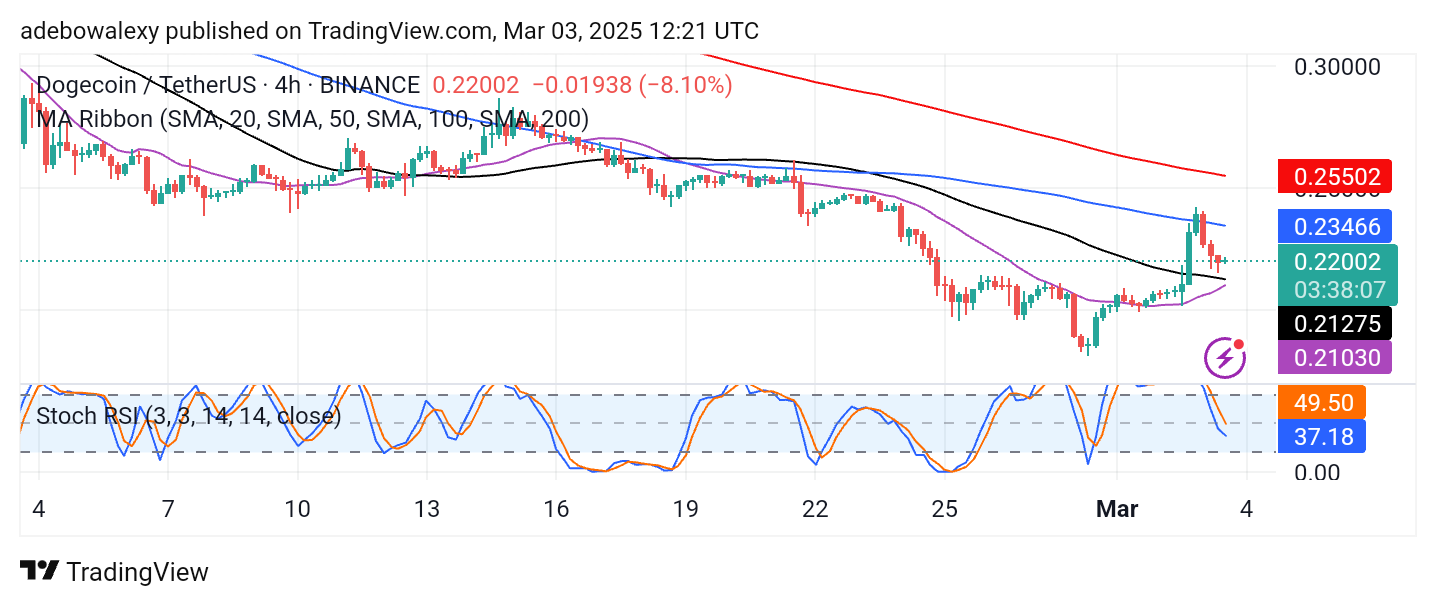
With the ongoing session showing some bearish signs, upside forces still seem to have a positive short-term outlook. At this point, traders can anticipate an upward rebound based on the behavior of the MA lines.
Although the Stochastic RSI lines still have a downward slope, the lead line of the indicator has shown a slight deflection, hinting at a possible bullish reversal. Given this, traders could set their sights on the $0.2500 price level as a potential target.