Tamadoge (TAMA/USD) Bulls Face Key Hurdle at $0.0006 in Recovery Push
Estimated Reading Time: 3 minutes
Don’t invest unless you’re prepared to lose all the money you invest. This is a high-risk investment and you are unlikely to be protected if something goes wrong. Take 2 minutes to learn more
The TAMA/USD market has initiated an upward movement. During the early trading sessions on February 8, the market established support around the $0.00074 level. As bullish momentum gradually strengthened, the price began to recover.
The uptrend gained traction, with buyers reclaiming control at the $0.0008 level. A successful breakout above this resistance further fueled bullish sentiment, driving a significant surge and reinforcing the positive crypto signal outlook.
Key Levels
- Resistance: $0.0010, $0.0011, and $0.0012
- Support: $0.0007, $0.00065 and $0.0006
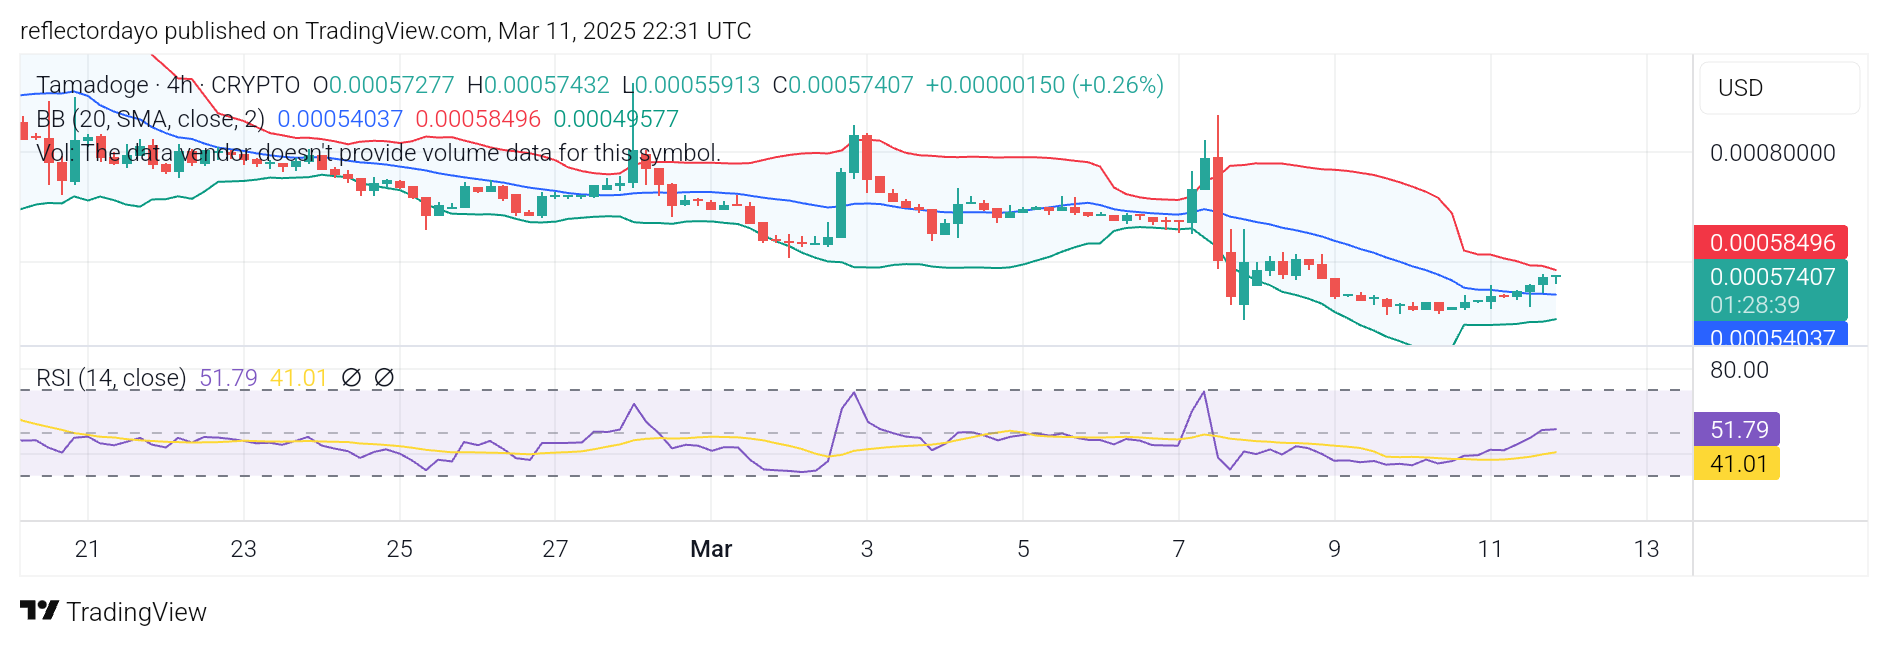
TAMA/USD Price Analysis: The Indicators Point of View
The TAMA/USD market’s recovery from below the $0.0008 level encountered strong resistance from sellers, temporarily slowing upward momentum. However, the bulls eventually regained control, and as the price broke above this level, trader optimism surged, driving increased buying activity.
The candlestick for the current 4-hour trading session reflects strong bullish dominance, with buyers firmly in control and minimal selling pressure. The Relative Strength Index (RSI) indicates that bullish momentum still has room for further gains. However, the Bollinger Bands show the price pushing beyond the upper band, suggesting the market may be entering overbought territory.
As this marks the first major bullish breakout, there could be additional upside potential, offering opportunities for optimistic traders.
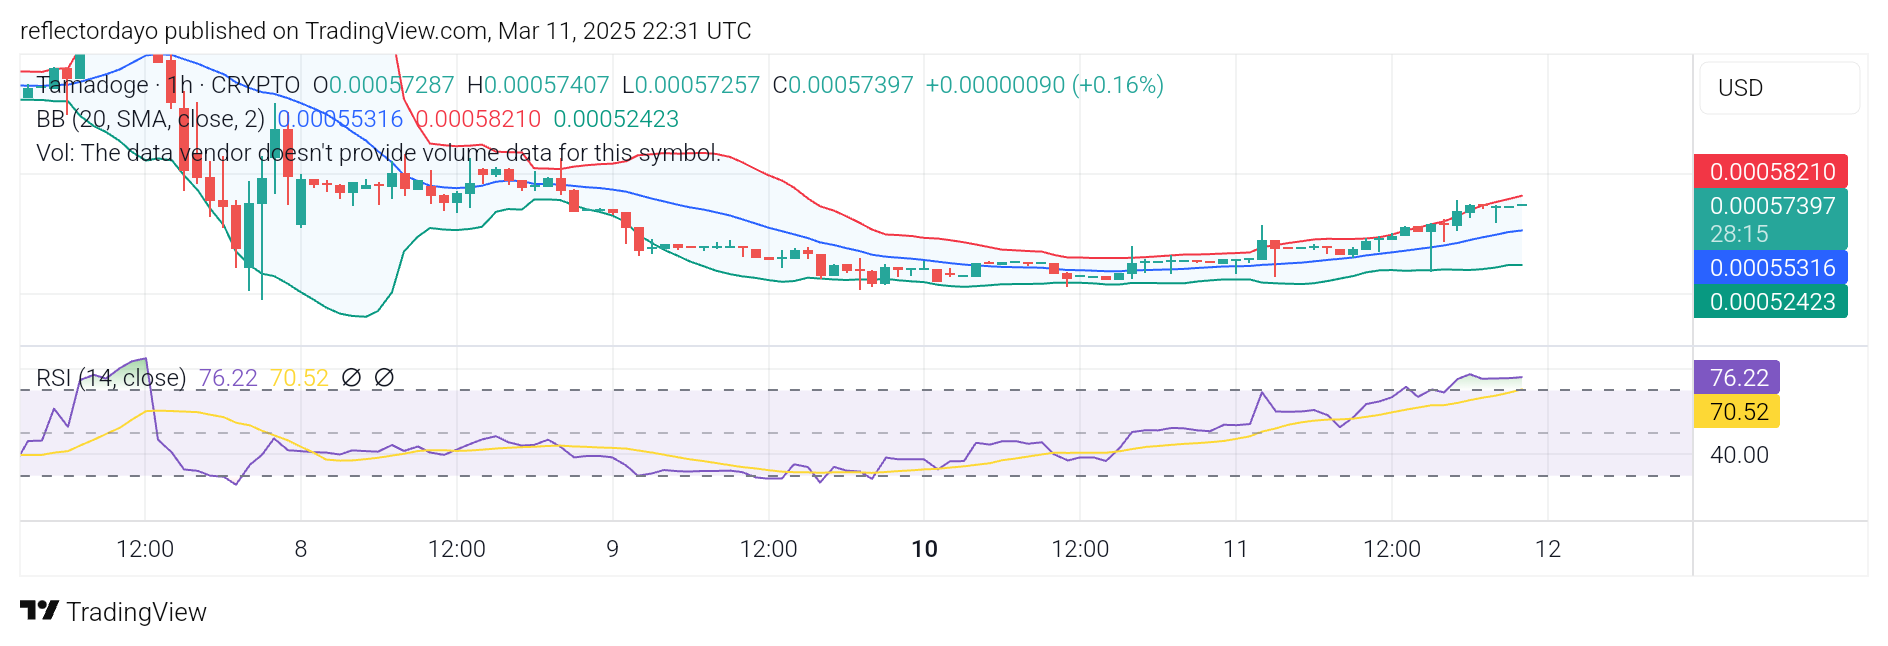
Tamadoge Short-Term Outlook: 1-Hour Chart
Analyzing the market from a smaller timeframe, we observe that the sharp surge in bullish sentiment has driven a significant price increase, resulting in a noticeable expansion of the Bollinger Bands. This widening suggests heightened volatility and the potential for sudden price fluctuations.
Despite this, the strength of the current bullish momentum favors buyers in establishing higher support around the $0.00085 level. If this support holds, buyers could build further momentum, challenging the $0.0009 resistance level and potentially driving the market higher.
Buy Tamadoge!
Fill your weekend by playing five exhilarating play-to-earn arcade games! 🕹️💰
Battle your way to the top of the weekly leaderboards and load up on $TAMA rewards!
Download on mobile now 👇
📱 Android: https://t.co/D4TjX7gTFl
📱 iOS: https://t.co/0fjJapf5oA pic.twitter.com/6MCruiKcet— TAMADOGE (@Tamadogecoin) September 13, 2024