Bitcoin (BTC/USD) Market Shows Bullish Momentum As Price Breaks Key Resistance
Estimated Reading Time: 3 minutes
Don’t invest unless you’re prepared to lose all the money you invest. This is a high-risk investment and you are unlikely to be protected if something goes wrong. Take 2 minutes to learn more

Bitcoin Price Prediction – March 6
The BTC market shows bullish momentum as the price breaks key resistance. An invalidation of the diagonal resistance is expected as prices continue to rally upward.
The indicators suggest a bullish reversal, with the RSI at 47.36 rising from oversold conditions, indicating increasing buying pressure. The 9-day SMA (Simple Moving Average) at $87,570 is acting as dynamic support, and a breakout above it confirms the potential for further upside. The recent push above this level signals renewed momentum, which could drive Bitcoin toward higher resistance zones.
BTC/USD Market Key Levels:
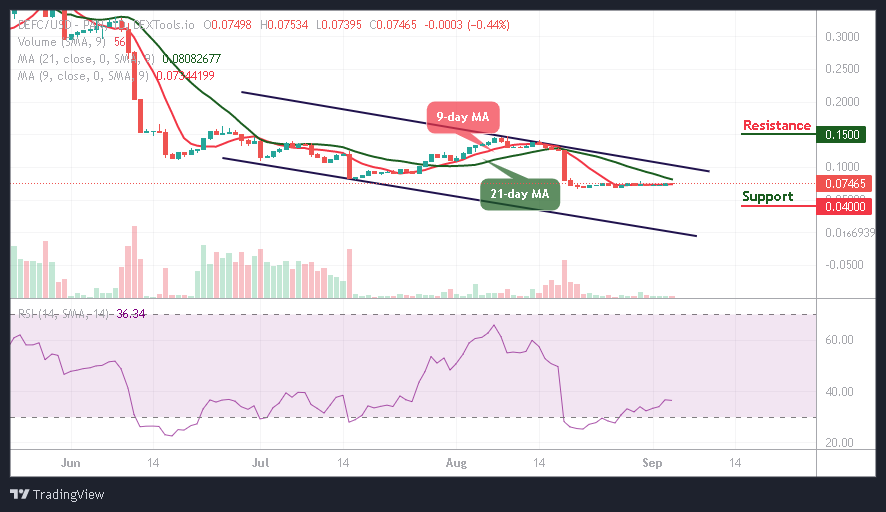
Resistance Levels: $100,000, $108,390, $115,000
Support Levels: $85,010, $66,780, $53,500
 BTC/USD – Daily Chart
 BTC/USD – Daily Chart
The BTCUSD daily chart shows a massive rally to the upside as a notable breakout becomes imminent.
Price action confirms bullish intent as Bitcoin has rebounded strongly from the $85,000 support zone, which aligned with a fair value gap (FVG) and key historical demand levels. A descending trendline was recently broken, indicating that bearish pressure is weakening.
The strong rejection from below $80,000 shows buyers are stepping in aggressively to push the price higher. Bitcoin is now attempting to break through the diagonal resistance, which, if flipped into support, could confirm a sustained bullish trend.
What is the likely projection of BTCUSD?
With this bullish setup, Bitcoin is likely to target the $100,000 psychological level in the near term. If the rally clears this level, the next resistance sits around $108,390, with a final target near $115,000.
However, failure to hold above $85,000 could slow down the momentum and lead to a retest of lower levels. For now, the trend remains bullish, and Bitcoin is poised for further gains.
BTC/USD – Four-Hour Chart
 BTC/USD – Four-Hour Chart
BTCUSD has broken out from a descending trendline, signaling a potential bullish continuation. The RSI at 57.21 shows increasing momentum, while the 9-day SMA at $90,130 is acting as dynamic support.
Price recently bounced off the $85,010 level, confirming strong demand in that area. A successful push above $91,910 could drive BTC toward the key $100,000 resistance, with further upside potential toward $108,390 and $109,360.
Bitcoin (BTC) Current Statistics
The current price: $90,840
Market Capitalization: $1,750,000,000,000
Trading Volume: $44,940,000,000
You can purchase Bitcoin here. Buy BTC