Bitcoin Price Prediction: BTC/USDT Market Contracts
Estimated Reading Time: 3 minutes
Don’t invest unless you’re prepared to lose all the money you invest. This is a high-risk investment and you are unlikely to be protected if something goes wrong. Take 2 minutes to learn more

Bitcoin Price Prediction (February 19):
Price action in the Bitcoin market has contracted significantly, even though price activity has maintained support above the $90,000 and $92,000 levels. This is quite striking and may hint at an impending upside correction.
BTC/USDT Long-Term Trend: Bullish (Daily Chart)
Key Price Levels:
Resistance: $100,000, $105,000, $110,000
Support: $95,000, $90,000, $85,000
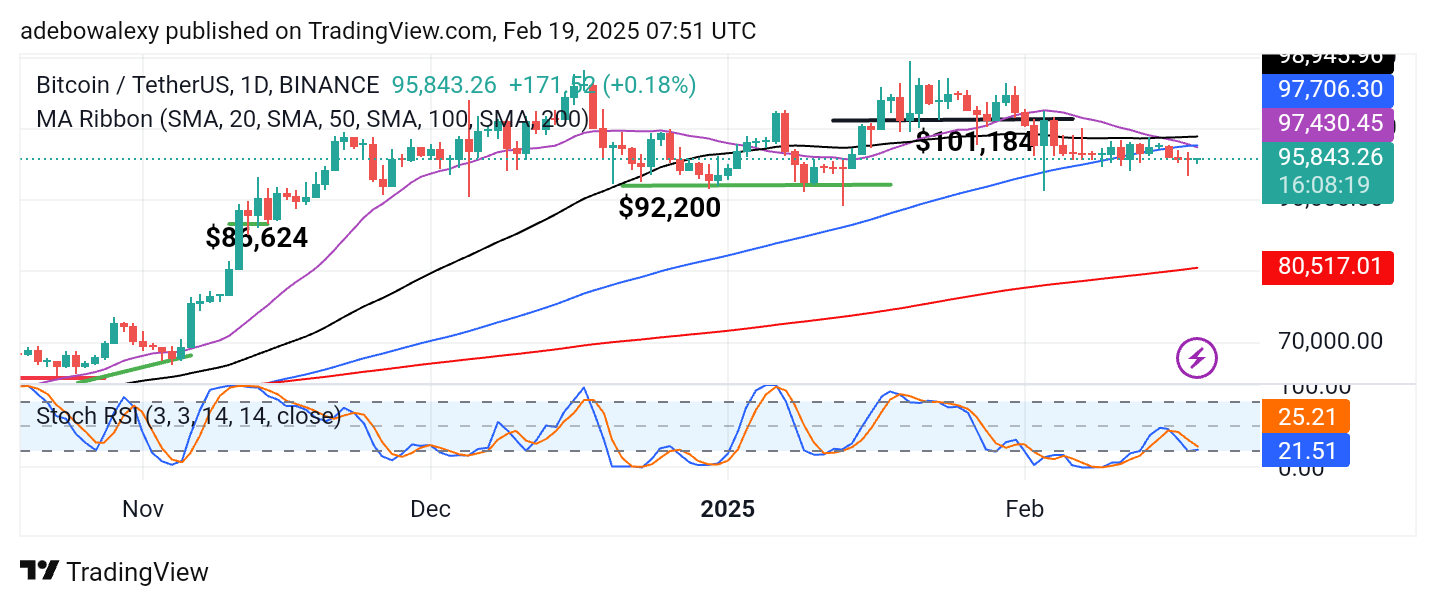
Buying activity has continued to dominate among market participants. As a result, the last candle price on this daily chart appeared green. Meanwhile, the Moving Average (MA) lines are crossing above recent price candles. The 20-, 50-, and 100-day MA lines are positioned above the price action, suggesting potential resistance.
At the same time, the Stochastic RSI lines converge for a crossover just above the 20 threshold, which could indicate a potential bullish reversal.
Bitcoin Price Prediction: BTC/USDT Bulls Under Heavy Pressure
Price activity on the Bitcoin daily chart is contracting significantly. Likewise, technical indicators suggest that downward forces are strengthening. As a result, price action remains below most of the MA lines on the chart. Additionally, the 20- and 200-day MA lines have recently formed a crossover above price action, signaling a bearish trend.
However, the last price candle on the chart is green, despite its contracted appearance. Meanwhile, the Stochastic RSI lines are approaching an upside crossover just above the 20 threshold. This suggests that bullish momentum could rebound strongly.
Bitcoin Price Prediction: BTC/USDT Faces Resistance at $98,000 (4-Hour Chart)
Switching to the 4-hour Bitcoin chart, price action has rebounded upward since dipping below the $96,000 level. However, it remains trapped below the $98,000 resistance level. Price action has attempted to break this resistance since the previous session but has been unsuccessful.
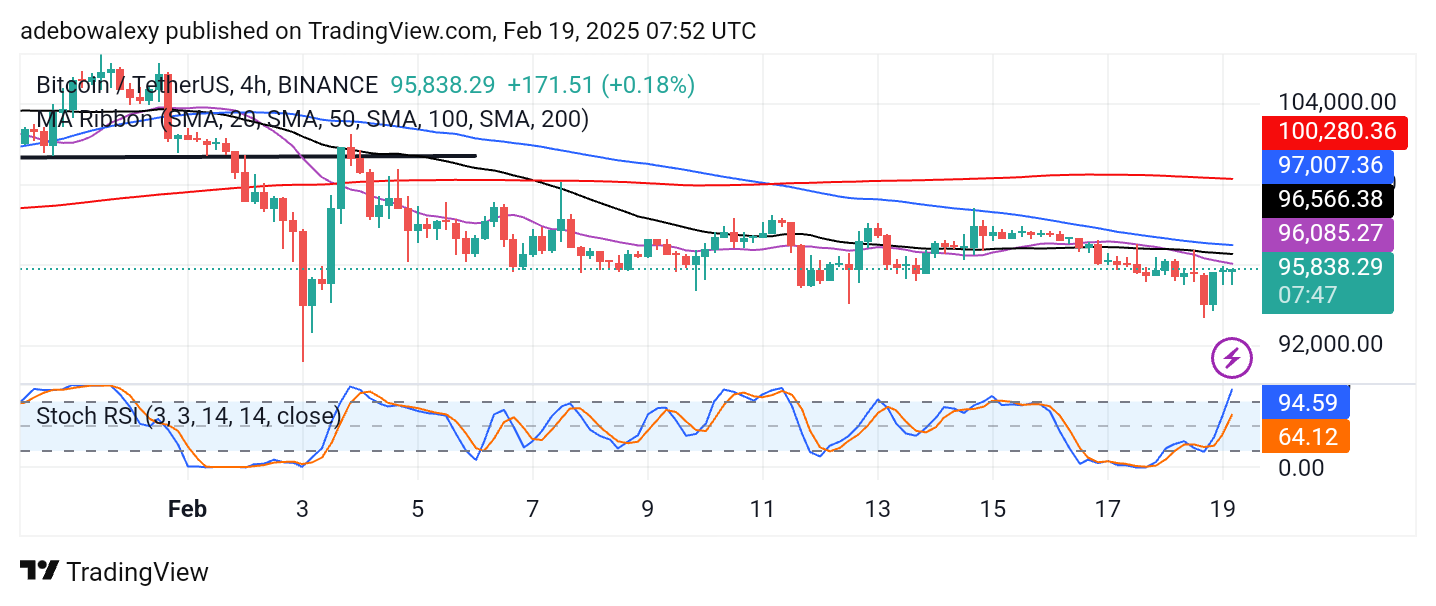
The Stochastic RSI lines are still rising into the overbought region, indicating that bullish pressure is building. However, price action remains below all MA lines, forming a strong barrier to further upward movement. Consequently, unless a strong fundamental catalyst supports the upside retracement, price action in this market may continue downward towards the $92,000 price level.