Bitcoin Price Prediction: BTC/USDT Recovers From a Sharp Retracement
Estimated Reading Time: 3 minutes
Don’t invest unless you’re prepared to lose all the money you invest. This is a high-risk investment and you are unlikely to be protected if something goes wrong. Take 2 minutes to learn more

Bitcoin Price Prediction (December 25):
Bitcoin previously dipped considerably from well above $100,000 to below the $95,000 price. This shook the crypto market as other coins also felt the impact, with most nosediving. However, this coin has changed course as its price action rebounded at the $95,000 price level.
BTC/USDT Long-Term Trend: Bearish (Daily Chart)
Key Price Levels:
Resistance: $100,000, $105,000, $110,000
Support: $95,000, $90,000, $85,000
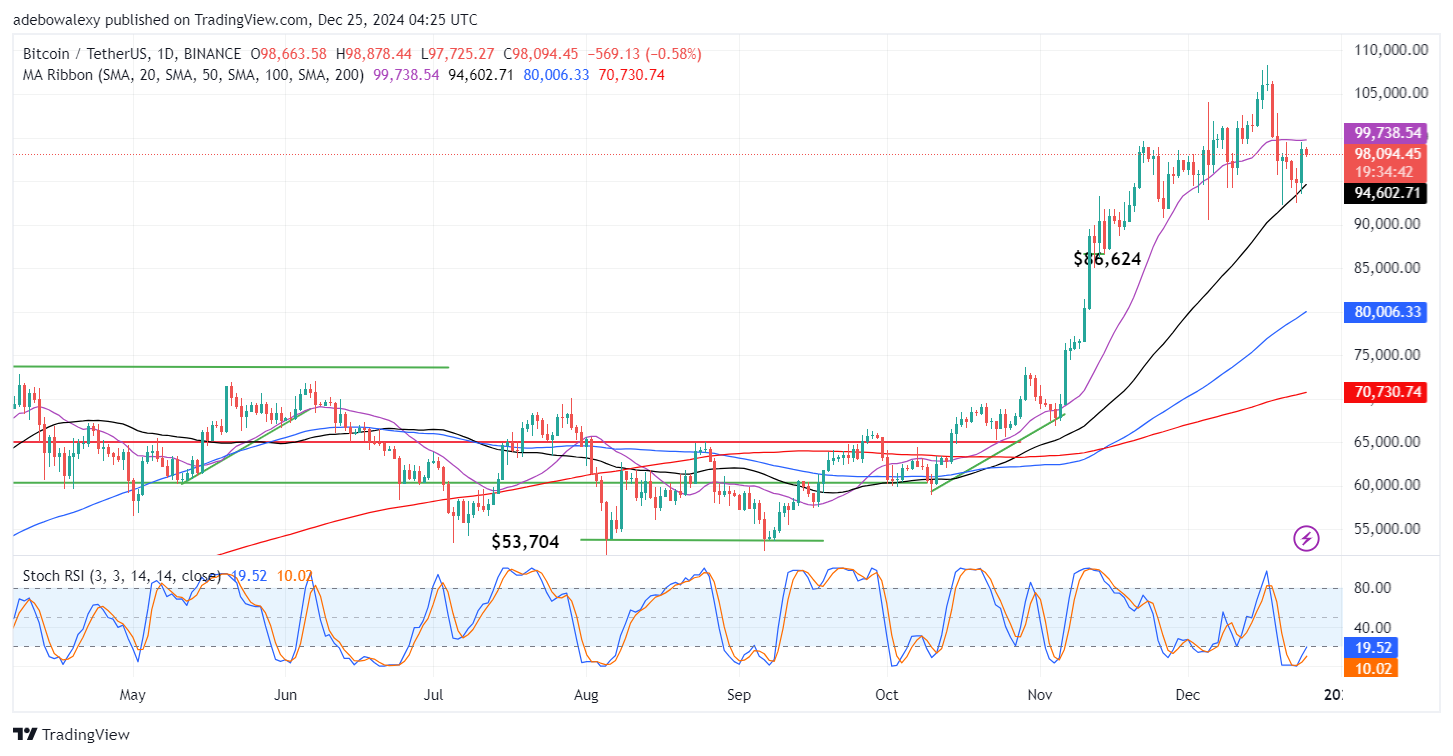
The BTC market has rebounded a bit downward off the resistance at the $95,000 price level. The mentioned resistance is almost at the same level as the 20-day Moving Average (MA) curve. The last price candle on this price chart is a red one but has a full body and, as such, keeps the market at a significant level above the 50-day MA line. Also, the Stochastic Relative Strength Index (RSI) lines are rising steadily despite the downward retracement of price action.
Bitcoin Price Prediction: BTC/USDT Has a Good Chance of Breaching the $95,000 Ceiling
The upside rebound of price action in the BTC daily chart seems to have biased the market to favor buyers. This is because price action has, as a result, closed in on the last MA lines up ahead. However, the ongoing session has introduced a bit of bearish retracement in the ongoing session. Also, traders will agree that the minor downward retracement is normal considering the sharp upside rebound in the previous session.
In addition, the Stochastic RSI lines are still rising upward without hinting at a bearish crossover. Consequently, market participants can very much anticipate a continued upside retracement through the 20-day MA lines that have constituted resistance to price action.
Bitcoin Price Prediction: BTC/USDT Bulls Look Vulnerable (4-Hour Chart)
Bitcoin’s price on the 4-hour chart has it that price action lies below most MA lines. However, the last price candle is a green one despite being below all the MA lines and its small size. The market, however, remains above the 20-day MA line. The Stochastic RSI lines are above the 80 threshold level and lie in the overbought region.
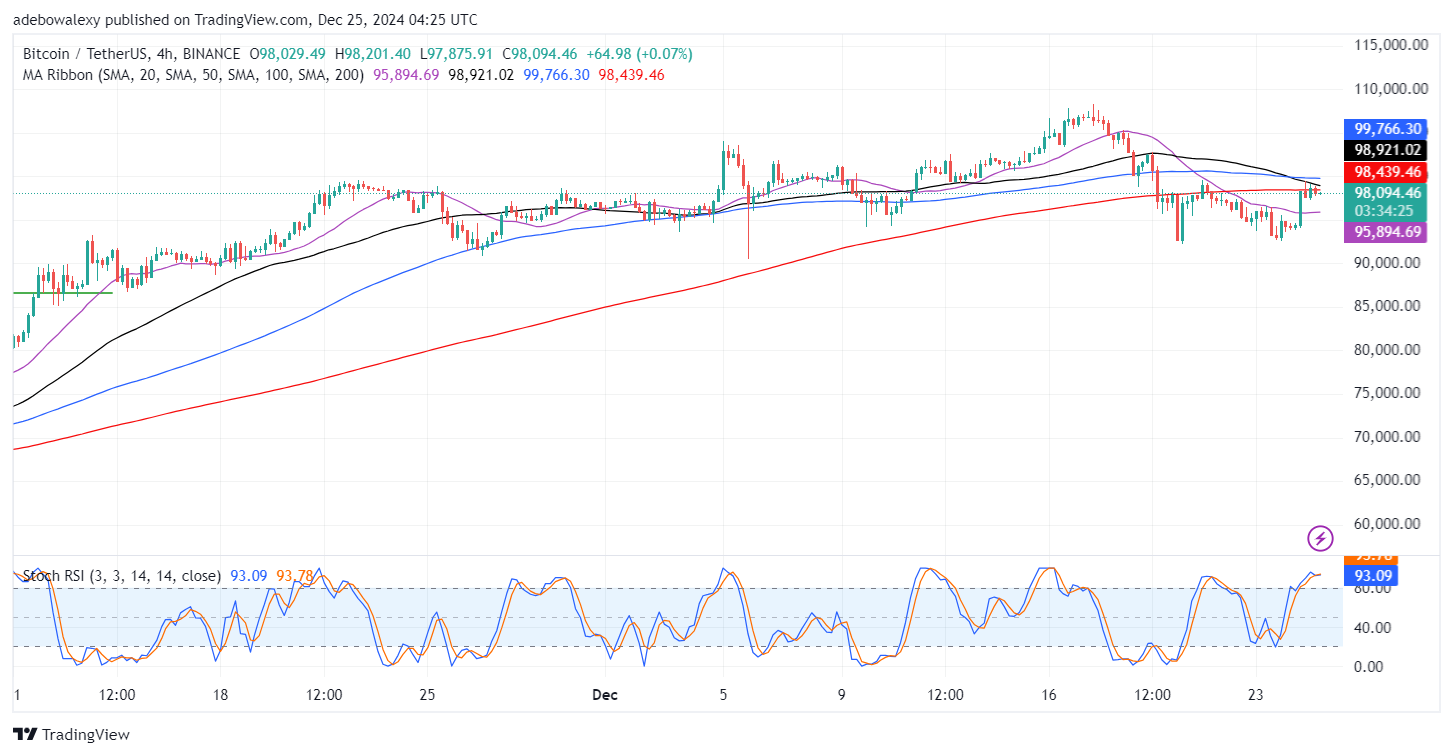
Price activity in the BTC market still tends mostly towards a continued upward path. This can be seen as price action lurking just below the 200-day MA while at a significant distance above the 20-day MA lines. Meanwhile, the Stochastic RSI lines are in the overbought region while they maintain a slight upward trajectory. The last price candle there is also green despite appearing very small-sized. Therefore, traders may aim at the 98,000 or even the $100,000 threshold.