BNB (BNB/USDT) Bulls Holding the Line as Bearish Pressure Returns
Estimated Reading Time: 3 minutes
Don’t invest unless you’re prepared to lose all the money you invest. This is a high-risk investment and you are unlikely to be protected if something goes wrong. Take 2 minutes to learn more
BNB Long-term Analysis: Ranging
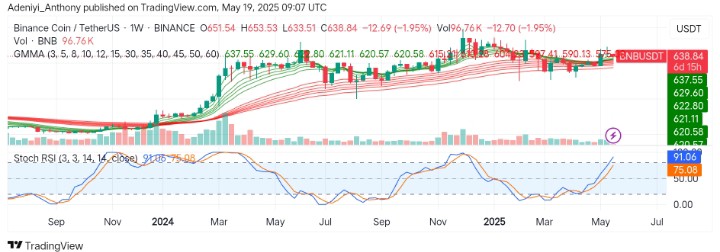
After a long period of prolonged sideways movement, the market for BNB against the Tether is showing signs of recovery. However, the recent candle shows there has been a tug-of-war between the bulls and bears, with tightening volatility and a gradual return of bullish momentum.
Recently, the Guppy Multiple Moving Averages (GMMAs) are compressed, signaling a potential breakout scenario is about to play out. However, the Stochastic RSI has surged to an extremely overbought level, signaling further upside movement may be hindered by a potential short-term correction.
Currently, BNB trades at $638.84, printing over 90 thousand volumes on the first day of the week.
Technical Indicators
Major Resistance Levels: $653, $680, and $700
Major Support Levels: $620, $600, and $575
BNB Technical Analysis
The analysis of BNB against the Tether on the weekly timeframe shows the pair has shown resilience above the $600 level despite the uncertainty that clouds the market. As it stands, the price is currently above the set of short-period EMAs, indicating early signs of a bullish trend resumption.
On the other hand, the Stochastic oscillator warns of a potential pullback as the blue line of the indicator reads above the 90-mark level. However, the volume is still relatively light, showing a lack of conviction by the bulls.
To this end, the pair’s market structure remains bullish, and a close above $653 with a strong volume would confirm bullish continuation; otherwise, the market might experience continued sideways movement.
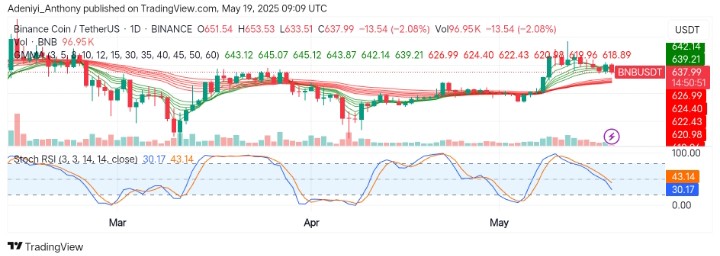
BNB/USDT Analysis: Can the $600 Base Trigger the Next Rally?
On the daily chart, BNB/USDT is trades at $637.99, with over a 2% loss and a bearish candle after failing to hold above the $640 level. However, the GMMAs seem to converge downward, suggesting weakening bullish momentum.
On the other hand, the oscillator beneath the chart faces south, signaling potential short-term bearish continuation as the lines tend downward.
To this end, a break below the immediate support would push the price below $600. However, reclaiming the $645 level with strong volume could spark a bullish recovery.
You can purchase crypto coins here. Buy LBlock