BNB (BNB/USDT) Faces Resistance as It Struggles to Break Key Levels
Estimated Reading Time: 3 minutes
Don’t invest unless you’re prepared to lose all the money you invest. This is a high-risk investment and you are unlikely to be protected if something goes wrong. Take 2 minutes to learn more
The market for BNB against Tether has dropped 0.9% over the last daily trading session, continuing its mild weekly slope to the south. As it stands, the $900 resistance, mixed sentiment around the BNB ecosystem, and the whales’ selling activities have been suggested to be the influencing factors of the current action.
At the moment, the pair appears to be improving toward $903. Meanwhile, the Guppy Multiple Moving Averages (GMMA) still display a bearish sentiment.
Currently, BNB trades at $890.30, with the MACD momentum indicator indicating pressure may be building to the north.
Technical Indicators
Major Resistance Levels: $890.62, $903.41, and $916.52
Major Support Levels: $888.21, $876.31, and $869.94
Technical Analysis
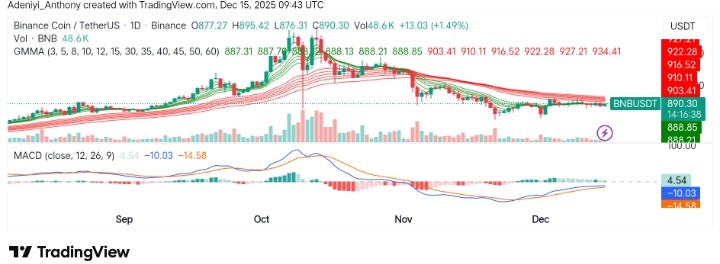
On the daily chart, BNB against Tether shows a recent mild uptrend, with the price now testing resistance levels around $890.62, only to face rejection. As it stands, the moving averages (GMMA) indicate that the short-term momentum is still weak, with the pair operating below the previous resistance level.
On the other hand, the MACD is also showing a bearish divergence, suggesting that the price may consolidate or face further resistance at higher levels. As it stands, the volume is relatively stable, signaling indecision in the market.
To this end, if momentum increases above the current level, a move into the $900 level may be spotted; otherwise, the pair risks a fall into the $870 to $860 level.
Update on BNB
Over the last 24 hours, BNB has tilted slightly below $890, a move that has placed the token under short-term pressure. As it stands, the market activities for the token remain unpredictable, but buying pressure seems to have dropped significantly. To this end, bullish participants appear to be monitoring the momentum to get any stabilization clue as volatility remains moderate and market bias slightly turns in favor of the bears.
BNB/USDT Analysis: Is $890 the New Base?
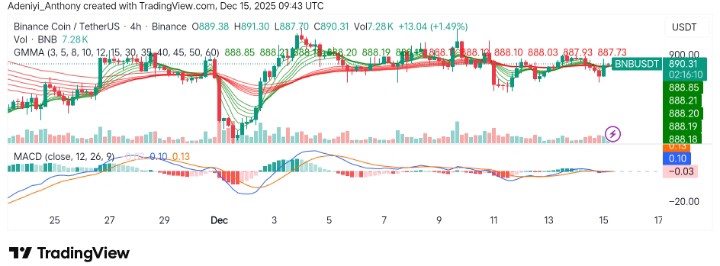
On the 4-hour chart, BNB/USDT is showing signs of short-term recovery with a minor rebound after operating at the $888 support level. As it stands, the price is hovering around $890, attempting to use this level as support to the north. Meanwhile, the MACD is indicating a potential bullish crossover, which could suggest further upward movement if $890 holds.
To this end, the pair could see a move to the upside soon, provided the $890 level is secured, as the GMMA lines are now consolidating, indicating a potential price breakout in the near term.
You can purchase crypto coins here. Buy Crypto