BNB (BNB/USDT) Surges Amid Technical Breakout, Reclaiming Key Support
Estimated Reading Time: 3 minutes
Don’t invest unless you’re prepared to lose all the money you invest. This is a high-risk investment and you are unlikely to be protected if something goes wrong. Take 2 minutes to learn more
The market for BNB against Tether has risen 1.6% over the past 24 hours, giving out a positive signal alongside the broader crypto market, which saw a 2.28% increase. As it stands, the licensing of Binance in Abu Dhabi, which has generated positive sentiment, further strengthening the token’s market position, and the technical surge in recent times are the major drivers behind this development.
At the moment, BNB trades at $910.01 with more than 49,330 traded volumes already. However, some caution remains due to market volatility.
Technical Indicators
Major Resistance Levels: $912, $995, and $1,000
Major Support Levels: $900, $876, and $861
Technical Analysis
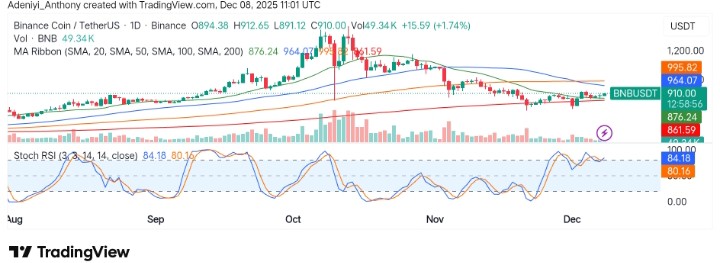
On the daily chart, BNB against Tether is showing a clear recovery above the 20-day and 100-day MAs. Meanwhile, the stochastic RSI’s position above the 80-level indicates strong bullish momentum, although it is approaching overbought territory, suggesting a short-term pullback is lurking.
As it stands, the volume bar appears to be picking up, indicating a potential move towards $912 for a potential move above $995.
WOW!
Have a look at this monthly chart of $BNB @binance
Sitting right in the cradle zone and looking about as good as a trend gets.
Still a long way to go until the month ends but this is a very good looking chart right now.
Will the recent @cz_binance pardon lead to US… pic.twitter.com/jXtyrhLs2K
— Trader Cobb (@TraderCobb) December 8, 2025
Meanwhile, @Tradercobb has shared an optimistic BNB, highlighting its strong performance over the longer period timeframe. The analyst posits that the coin is currently positioned in the “cradle zone,” a technical indicator often associated with upward trends. To this end, the trader notes that the chart looks very promising, although it’s still early in the month, and expresses hope that Binance CEO CZ’s recent pardon could positively impact the coin’s future performance.
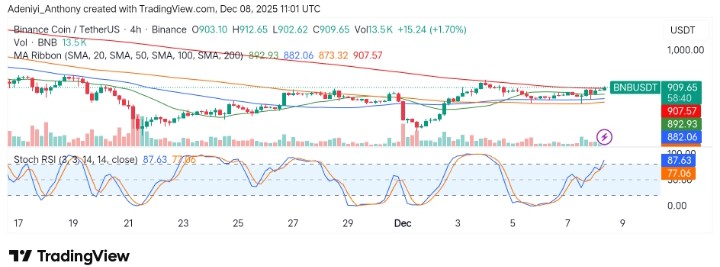
BNB/USDT Analysis: Gearing Up Towards $912
On the 4-hour chart, BNB/USDT appears stuck around $908 resistance. While the price action has been supported by the 20, 50, and 100-period MAs, the coin is encountering selling pressure around the long-period SMAs.
Meanwhile, the Stochastic RSI, on the other hand, indicates a small opening for further movement upside. However, the coin appears overbought in the short term, which could signal a possible price pullback or continued sideways movement.
Conclusively, if the pair can record a break above $908, a renewed bullish momentum could be seen; otherwise, failure to do so may prompt a correction toward the $892 and $882 support levels.
You can purchase crypto coins here. Buy Crypto