BNB (BNB/USDT) Shows Weakening Trend as Price Falls Below Key Moving Averages
Estimated Reading Time: 3 minutes
Don’t invest unless you’re prepared to lose all the money you invest. This is a high-risk investment and you are unlikely to be protected if something goes wrong. Take 2 minutes to learn more
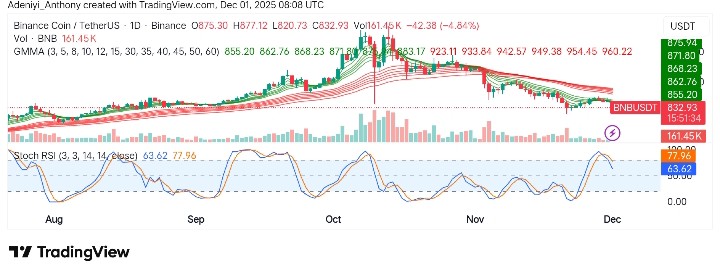
The analysis of BNB against Tether in recent times has been in a broader downtrend since the peak in October. Consistently, the price has been forming lower highs, but each relief rally has run into the thick resistance, confirming persistent sell-side pressure as the price dipped 4.84% to the south.
Meanwhile, this underperformance can be linked to the widespread market deleveraging, with $646 million in liquidations. Additionally, a prevailing risk-off sentiment in the market is contributing to the downturn, with the greed-fear index signaling caution among traders.
As it stands, the recent daily candle indicates a renewed downward push after a failed attempt to recover above the short-term averages. Additionally, the Guppy Multiple Moving Averages (GMMA) and Stochastic RSI are signaling an imminent move to the south, with a bearish sentiment.
Currently, BNB trades at $832.93 with over 161,000 daily traded volumes.
Technical Indicators
Major Resistance Levels: $852, $875, and $922
Major Support Levels: $800, $770, and $750
Technical Analysis
Technically, BNB against Tether appears to be on a strong downtrend; the pair’s price is dipping to the south from what seems to be its peak in October. As it stands, all short-term EMAs remain under long-term bands, clarifying bearish divergence and a show of prolonged bearish momentum. In recent times, the price has attempted to reclaim the $860–$880 level but was rejected strongly, indicating sellers remain dominant, as the price declined by about 5%.
From another angle, the oscillator is curling down from 77, signaling a typical continuation of the downtrend. This suggests continuation of the broader daily downtrend unless BNB reclaims 880 with strong momentum.
$BNB is playing out that classic breakout and retest of the trend line.
I think we are setting up for a good week. https://t.co/lGKkb1NZKp pic.twitter.com/qAmUQ5t17S
— Hardy (@Degen_Hardy) December 1, 2025
Meanwhile, @Degen_Hardy has expressed optimism, suggesting the pair is undergoing a classic breakout and a retest of the trend line. The analyst believes the current price action could lead to a bigger move in the coming days.
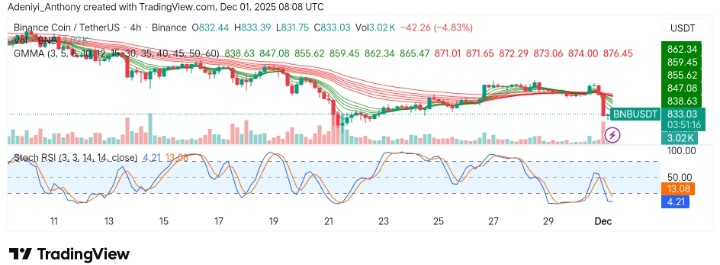
BNB/USDT Analysis: Facing Sharp Intraday Breakdown
Previously, on the 4-hour timeframe, BNB/USDT was oscillating around $869 and $886, hoping to gear up for an upside move. However, the momentum seems to be dropping, as the price drops abruptly toward $800. Currently, the short-term GMMA seems to be extending the current stance downward into the long-term bands, signaling a transition from equilibrium to renewed bearish pressure.
Meanwhile, the Stochastic RSI displays an extreme oversold condition, with the lines operating downwardly around 4.27, hoping for a reversal. However, the current oversold situation alone does not guarantee a reversal; it only signals weakening selling strength.
You can purchase crypto coins here. Buy Crypto