Cardano (ADA/USDT) Faces Strong Resistance Amid Continued Downtrend
Estimated Reading Time: 3 minutes
Don’t invest unless you’re prepared to lose all the money you invest. This is a high-risk investment and you are unlikely to be protected if something goes wrong. Take 2 minutes to learn more
In the last 24 hours, the market for Cardano against Tether, despite being faced with strong downward pressure in the past, has recorded a significant 6% positive move. This recovery, compared to the broader crypto market, appears to be far apart, as the latter saw a marginal gain of 1.75%.
Analysts believe Bitcoin’s stability amid reduced ETF outflows and confidence generated by the token’s large holders has triggered a crossover above the $0.35 resistance level as the formation of a falling wedge is spotted.
Currently, Cardano trades at $0.3589 with over 58 million traded volumes at the time of writing.
Technical Indicators
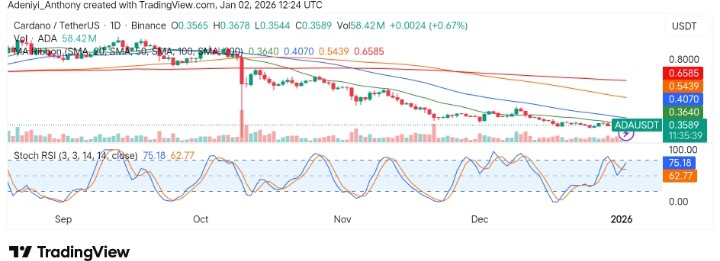
Major Resistance Levels: $0.4070, $0.5439, and $0.6585
Major Support Levels: $0.3544, $0.3500, and $0.3000
Technical Analysis
Technically, the daily chart reveals that Cardano against Tether is operating below a level where a significant recovery could be noticed. As it stands, the most noticeable resistance lies around $0.470. This suggests a potential obstacle for the price to reclaim higher levels. However, despite the recent mild uptick, the operation of the pair still lies under the moving average ribbon as the Stochastic RSI signals a near-overbought condition.
To this end, for a sustained increase to the north, the bulls must be ready to push higher into the $0.400 level by building a base above $0.3500; otherwise, the pair might end up below $0.3000.
Cardano Update
In recent times, the market for Cardano appears to have recorded a significant upside move on a nano degree chart setup. This suggests the token is launching itself straight into the next resistance. Meanwhile, at the present time, it looks like Bitcoin just reclaimed the 89k level, hoping ADA can share from the same upside story. However, much depends upon the seriousness of the bulls and their intentions to build a strong base at the current level.
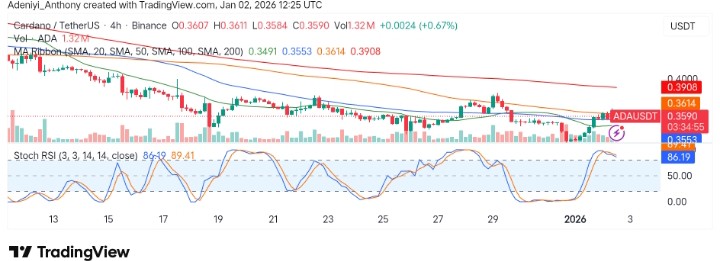
ADA/USDT Analysis: Resistance Ahead: What’s Next?
On the 4-hour chart, ADA/USDT is trading just above key support levels and facing short-term resistance near the SMA 100 at $0.3614. However, the Stochastic RSI shows overbought conditions (86.19 and 89.41). Additionally, this is signaling a possible short-term reversal as the lines curl to the south.
However, the pair operation appears to be in a choppy range, and a breakout above the SMA 100 could signal a temporary rally towards higher resistance levels. Meanwhile, the price action within a larger timeframe suggests bearish dominance.
You can purchase crypto coins here. Buy Crypto