Cardano (ADA/USDT) Traders Battle for Market Dominance
Estimated Reading Time: 3 minutes
Don’t invest unless you’re prepared to lose all the money you invest. This is a high-risk investment and you are unlikely to be protected if something goes wrong. Take 2 minutes to learn more
Cardano Long-term Analysis: Bullish
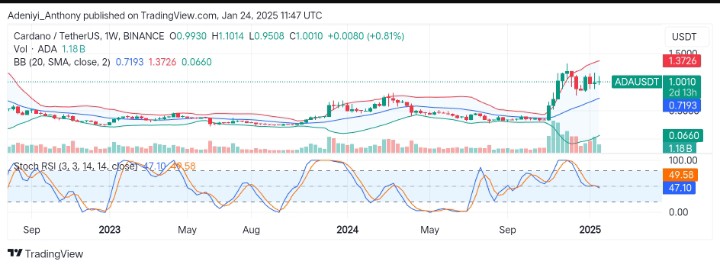
The market for Cardano against the Tether has experienced mixed sentiment, with the bulls and bears contesting for dominance. This picture shows the ongoing struggle in the market as the price flattens out despite over 1 billion traded volumes for the week.
Recently, ADA/USDT has seen a breakout from a prolonged downtrend after hitting $1.3700 in previous sessions. However, the ongoing sideways movement reflects indecision or a potential buildup as ADA/USDT sees a slight gain of 0.81% this week.
The Bollinger Bands on the chart signal that the pair is stabilizing, indicating possible upward pressure. However, caution is needed as the market traders battle for dominance.
Currently, Cardano trades at $1.0010, awaiting a move to either side.
Technical Indicators
Major Resistance Levels: $1.1000, $1.3700, and $1.5000
Major Support Levels: $1.0000, $0.9508, and $0.7493
Cardano Technical Analysis
The analysis of Cardano against the Tether on the weekly timeframe shows a market that is consolidating, awaiting a potential break in either direction.
Recent price actions between the upper segment of the Bollinger Bands indicate traders are battling to move the price in their favor. However, the bands suggest the pair may be in the buildup phase, awaiting an uptrend due to the slight uptick in price.
On the other hand, the Stochastic signals market lacks momentum as the lines move to the front directionless. However, the appearance of the blue line underneath the orange indicates bearish pressure may be increasing.
To this end, for upside movement, the price must break above mid-band towards $1.0000 with the oscillator’s lines changing direction towards the North.
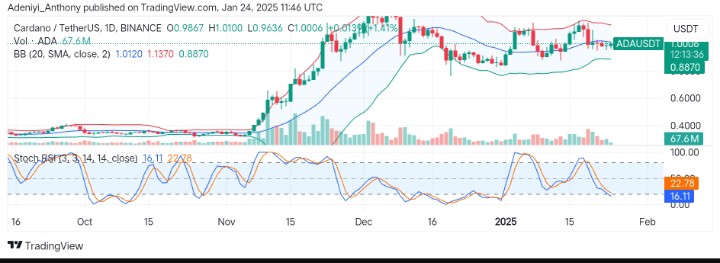
ADA/USDT Analysis: Which Side is Dominating?
On the daily chart, ADA/USDT is consolidating below the mid-band of the Bollinger band with a minor gain of 1.41% for the day. However, the tight Bollinger Bands signal decreasing volatility as $1.1200 acts as the immediate resistance.
The volume and Stochastic oscillator suggest bullish traders may soon dominate as the oscillator’s lines operate in the oversold region. However, with the increase in volume and change in the direction of the Stochastic RSI, ADA/USDT may break above $1.0120; otherwise, the price may dip towards $0.8870 soon.
You can purchase crypto coins here. Buy LBlock