Chainlink (LINK/USDT) Prepares to Build Base Above $16.00 Amid Hope of Renewed Upside Momentum
Estimated Reading Time: 3 minutes
Don’t invest unless you’re prepared to lose all the money you invest. This is a high-risk investment and you are unlikely to be protected if something goes wrong. Take 2 minutes to learn more

Chainlink Mid-term Analysis: Ranging
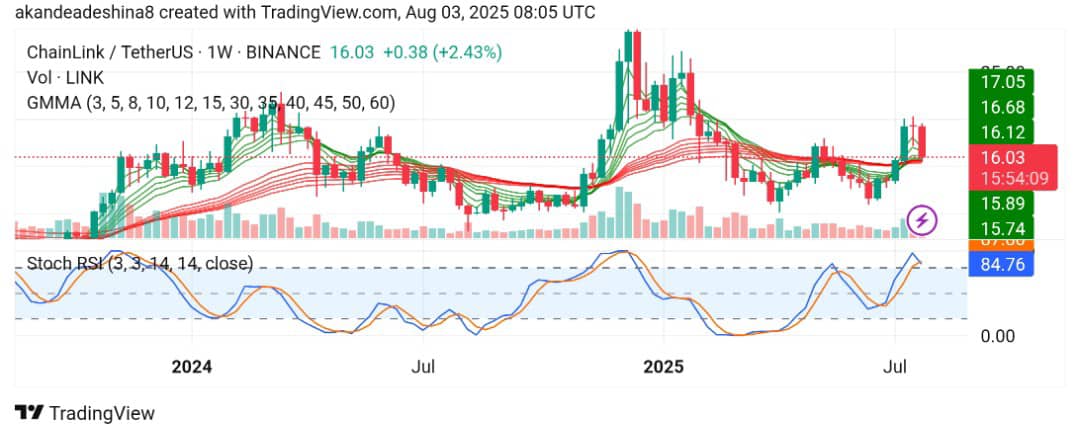
The market for Chainlink against Tether is exhibiting a bullish momentum recovery on the weekly chart after a prolonged consolidation phase. However, the price has broken above clustered Guppy Multiple Moving Averages (GMMA), signaling a potential trend reversal.
To this end, Link/USDT on the longer timeframe is on a short-term pullback, hoping to bounce in the coming session. Currently, Chainlink trades at $16.03 with 2.43% gains for the week.
Technical Indicators
Major Resistance Levels: $16.68, $17.05, and $18.80
Major Support Levels: $16.00, $15.00, and $13.20
Chainlink Technical Analysis
The analysis of Chainlink against Tether on a weekly timeframe shows the pair is in a technical recovery phase, supported by strong bullish momentum and a slight GMMA breakout as the pair attempts to hold above $16.00. The GMMA shows a slight breakout above EMAs, which are now acting as dynamic support. However, the compression and upward fanning of green short-term MAs confirm bullish sentiment as volume turns bullish.
On the other hand, the Stoch RSI reads 84.76, well above the 80 threshold, indicating overbought territory, and that bullish signal is intact. However, the curvature of the blue line shows the pair might experience a short-term pullback before going bullish.
To this end, a break above $15.74 would be a good entry point for buyers to come. However, caution is warranted, as a break below this level might suggest more downside movement.
LINK/USDT Analysis: Building a Strong Base
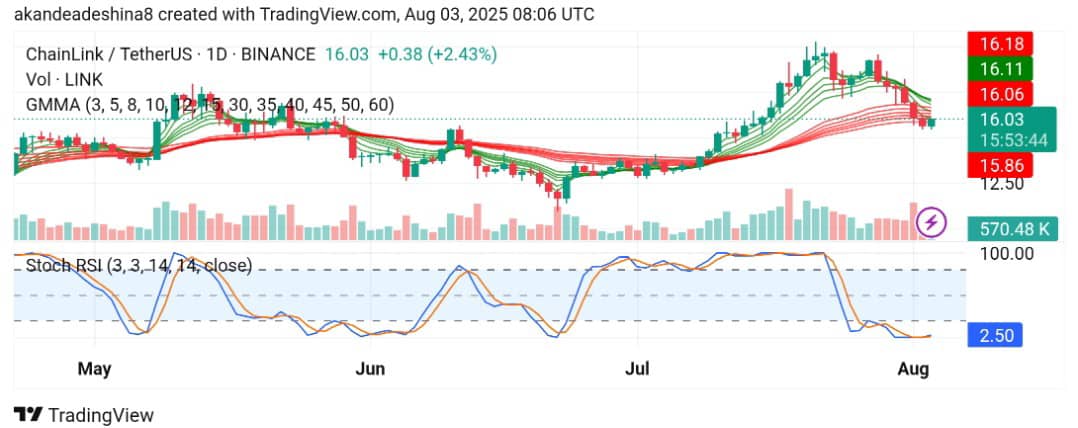
On the daily chart, LINK/USDT shows a short-term pullback into dynamic support near the GMMA cluster around $15.86–$16.00. However, the price action seems to be stabilizing after a decline into the oversold region.
From another angle, the Stoch RSI indicates an extreme oversold condition, setting the stage for a potential bullish rebound as the lines extend forward at 2.50. However, the GMMA convergence, on the other hand, signals a possible pause in the bearish momentum.
To this end, a move above $16.18 in the near term would confirm a move to the north as the support at $15.86 remains intact, forming a possible local bottom.
You can purchase crypto coins here. Buy LBlock