Compound Recovery Rally Pauses as Short-Term Momentum Wanes
Estimated Reading Time: 3 minutes
Don’t invest unless you’re prepared to lose all the money you invest. This is a high-risk investment and you are unlikely to be protected if something goes wrong. Take 2 minutes to learn more

COMP/USD Price Analysis – Compound Price Seeks Pullback
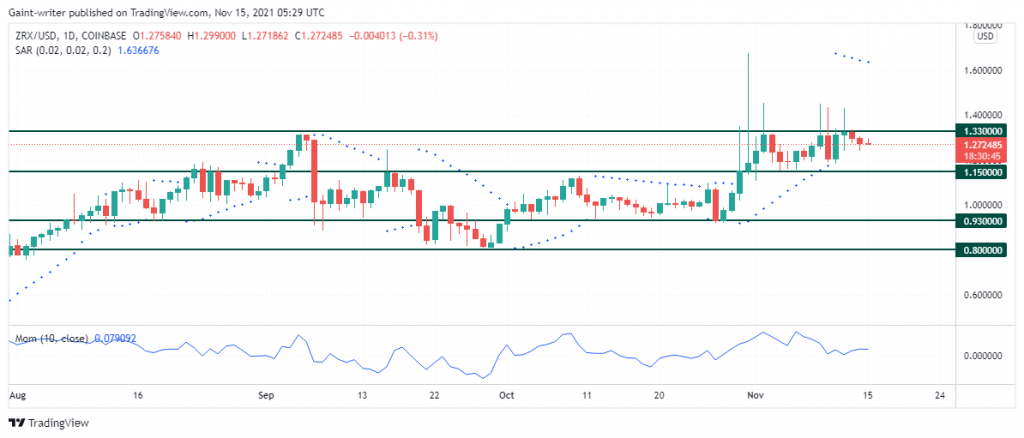
Compound market has staged a strong recovery from its early August lows, with a shift in momentum that has put buyers back in control on the daily timeframe. The price has rallied significantly from key support, and the broader outlook has improved. However, this bullish advance is now showing signs of short-term exhaustion, with indicators on the daily chart suggesting that a period of consolidation or a minor pullback is likely before the uptrend can continue.
Compound Key Levels
Support Levels: $43.12, $39.46
Resistance Levels: $50.36, $55.78

While still within its wide long-term range, Compound is currently being driven by bullish momentum. After a corrective phase in late July, the price found solid support at the $43.12 level and has since reversed course with conviction. This bounce has re-established a positive short-term outlook within the broader neutral structure.
Currently trading at $48.13, the asset is now pushing towards the middle of its range.
The successful defense of support and the subsequent rally indicate that buyers have regained control. Their next major objective will be to challenge the key psychological and technical resistance at $50.36.
The technical indicators on this chart have turned decisively bullish. The Momentum indicator has crossed above its baseline into positive territory, with a reading of 0.48. This confirms that the recent price action is being driven by buying pressure.
The Stochastic oscillator has also executed a clear bullish crossover from the oversold region, which is a classic buy signal indicating that the previous downtrend has lost its power and a recovery is in progress.

Market Expectation
The 4-hour chart provides a detailed look at the current uptrend that began in early August. The price has carved out a clear series of higher highs and higher lows. However, after a strong push, the rally now appears to be pausing. Trading at $48.13 with a slight loss of -0.33%, the price is entering a minor corrective phase.
While bulls are still in control of the short-term trend, the immediate upward thrust has weakened. This is a normal and often healthy development in a trending market, as it allows for a reset before the next potential move higher. The market is likely to consolidate between the recent highs and the nearest support before attempting to resume its ascent.
You can purchase Lucky Block here. Buy LBLOCK
Note: Cryptosignals.org is not a financial advisor. Do your research before investing your funds in any financial asset or presented product or event. We are not responsible for your investing result.