Dash 2 Trade Price Predictions for Today, May 27: D2TUSD Will Move Higher Soon
Estimated Reading Time: 4 minutes
Don’t invest unless you’re prepared to lose all the money you invest. This is a high-risk investment and you are unlikely to be protected if something goes wrong. Take 2 minutes to learn more

Dash 2 Trade Price Forecast: D2TUSD Will Move Higher Soon (May 27)
The D2TUSD market price will move higher soon to resume its upward trends with a potential reversal at the $0.00293 support level. The selling pressure may end soon as the coin market is approaching the oversold region. Thus, a bullish breakout confirmation that closes above the $0.00400 resistance level would indicate that the market is feeling more optimistic. Buyers will have a stronger base to continue this recovery if they take this action. As a result, a post-retest rally may drive prices higher and enable them to reach the $0.01000 resistance trend line.
Key Levels:
Resistance levels: $0.00500, $0.00600, $0.00700
Support levels: $0.00250, $0.00200, $0.00150
D2T (USD) Long-term Trend: Bearish (4H)
Dash 2 Trade market is bearish at the moment. The price bar is just below the two EMAs which are glued together. However, the current trend will soon be nullified as the market now approaches the oversold region.
The sell traders made a downward move to the $0.00296 support level before the end of yesterday’s session. This gave sellers more strength to continue with the trend in its recent low.
As the 4-hourly chart begins today, bearish actions sent the D2TUSD price lower, reaching the $0.00293 support level below the two EMAs.
Thus, more intraday gains would be recorded for the buy investors if the bulls exchange hands with the sell traders and close above the $0.00400 resistance value.
Moreover, investors can take advantage of this current opportunity to purchase the currency at a discount to pursue future gains.
Notably, as the Dash 2 Trade market moves closer to the daily stochastic oversold area, a price reversal at the aforementioned support is possible in the interim. In the long run, this anticipated bullish surge could break through the $0.00400 high point and reach the $0.01000 upper resistance value in the days ahead.
D2T (USD) Medium-term Trend: Bearish (1H Chart)
The D2TUSD pair is in a bearish movement zone in its medium-term outlook. This is due to the high inflow from the sell traders.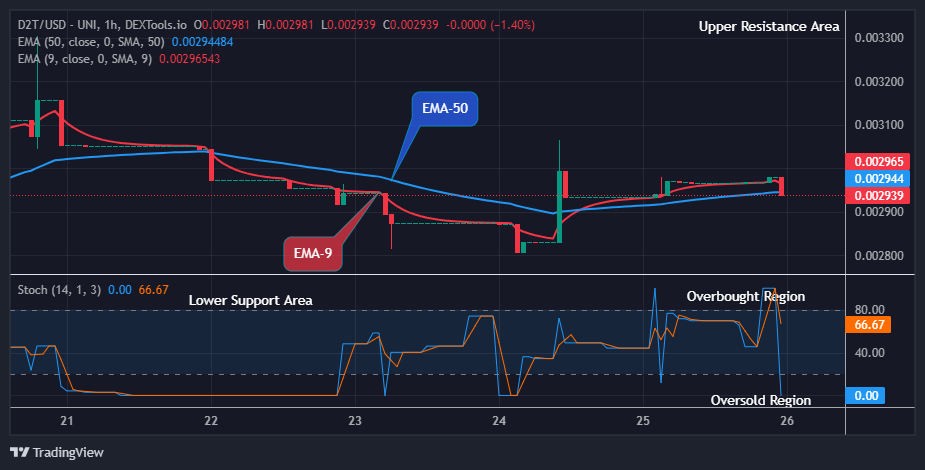
The sustained bearish pressure at the $0.00296 low value during the last session has made the coin price drop below the resistance levels in recent times.
Activities from the sell traders further drop the market value of Dash 2 Trade down to the $0.00293 support level as the 1-hourly chart opens today. However, this will soon be invalidated and the price will move higher soon as the market trend is oversold already.
With the overall market trend still bearish, if the bulls could increase their buying momentum, the coin price is likely to plunge higher and retest the high accumulation zone of the $0.00330 level.
Meanwhile, the D2TUSD might finish the downward correction and start reversing as the market is already oversold. If this is achieved by the long-term investors, the recovery rally may reach the $0.01000 upper high value in the coming days in its medium-term perspective.
Trading on liquid markets is safer and more advantageous! However, how do they appear in real life? Is it possible to determine a market’s liquidity?
Liquid markets are safer and better for trading!📊
— Dash 2 Trade (@dash2_trade) May 15, 2024
But what do they actually look like? Is there a way to see how liquid a market is?
Yes, there is! With a depth chart — one of the most useful tools in any trader’s arsenal.https://t.co/f34zJMlyWi
Want a coin that has a huge potential for massive returns? That coin is Dash 2 Trade. Buy D2T now.