Dogecoin (DOGE) Price Prediction: DOGE/USDT Nears Breaching a Three-Month-Old Support
Estimated Reading Time: 2 minutes
Don’t invest unless you’re prepared to lose all the money you invest. This is a high-risk investment and you are unlikely to be protected if something goes wrong. Take 2 minutes to learn more
Dogecoin (DOGE) Price Prediction – June 23, 2025
Following Bitcoin’s significant setback on Sunday due to escalating tensions in the Middle East, other altcoins—such as Dogecoin—also took a hit. As a result, DOGE is now approaching a price level last seen about three months ago.
DOGE/USDT Long-Term Trend: Bearish (Daily Chart)
Key Price Levels:
Resistance: $0.1600, $0.1800, $0.2000
Support: $0.1500, $0.1300, $0.1100
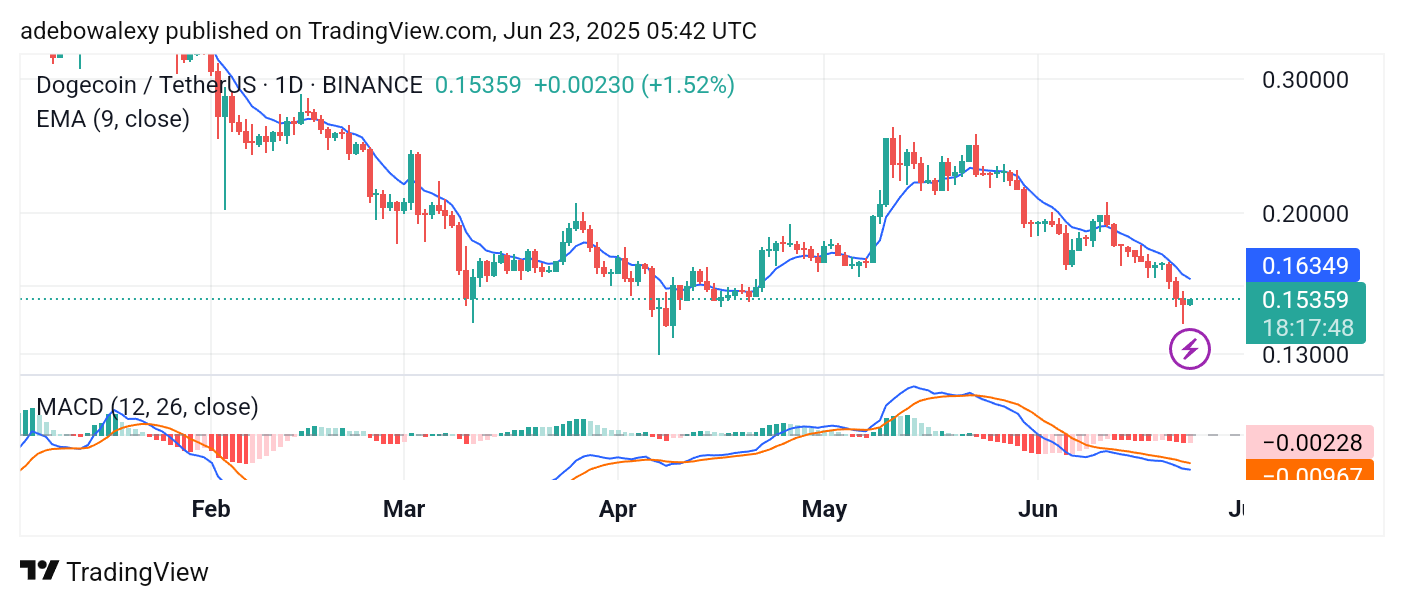
The current session’s price candle is green, yet it has formed below the 9-day Exponential Moving Average (EMA) line. Furthermore, the line of the Moving Average Convergence Divergence (MACD) indicator has fallen below the equilibrium level. Although it still follows a downward trajectory, the most recent MACD bar is pale red, suggesting an immediate softening in bearish sentiment.
Dogecoin (DOGE) Price Prediction: DOGE/USDT Maintains a General Downward Trajectory
While the last price candle on the Dogecoin daily chart is green, the fact that it stands below the 9-day EMA suggests the rebound may lack strength.
The candle is relatively small and lacks both upper and lower shadows—an indication that price pressure may be minimal at the moment. Moreover, although the MACD line still reflects prevailing bearish momentum, the latest histogram bar suggests that bearish pressure is fading slightly in the short term.
Dogecoin (DOGE) Price Prediction: DOGE/USDT Tests a Key Technical Resistance (4-Hour Chart)
On the 4-hour chart, Dogecoin has shown signs of a short-term rebound. However, the previous session’s candle still lies below the equilibrium level. Price activity is currently testing resistance formed by the 9-day EMA line.
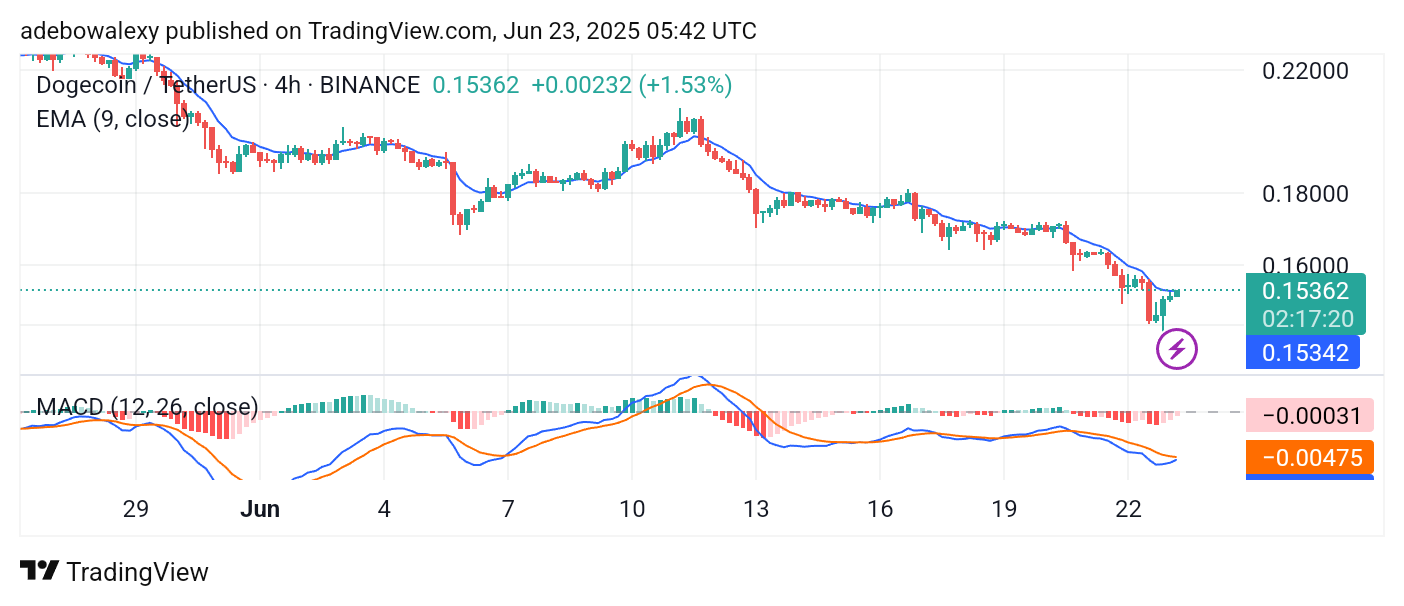
Meanwhile, the MACD lines are converging for a potential bullish crossover below the equilibrium level. Should buying momentum increase, price action may break through the 9-day EMA resistance—potentially pushing toward the $0.1800 level.