Dogecoin (DOGE) Price Prediction: DOGE/USDT Retreats Toward the $0.1000 Baseline
Estimated Reading Time: 3 minutes
Don’t invest unless you’re prepared to lose all the money you invest. This is a high-risk investment and you are unlikely to be protected if something goes wrong. Take 2 minutes to learn more

Date: February 16, 2026
The Dogecoin market had previously experienced some notable upward movement. However, the market has since seen a pullback and, as such, now threatens the recent upward trajectory.
DOGE/USDT Long-Term Trend — Bearish (Daily Chart)
Key Price Levels
Resistance: $0.1100, $0.1250, $0.1400
Support: $0.1000, $0.0900, $0.0800
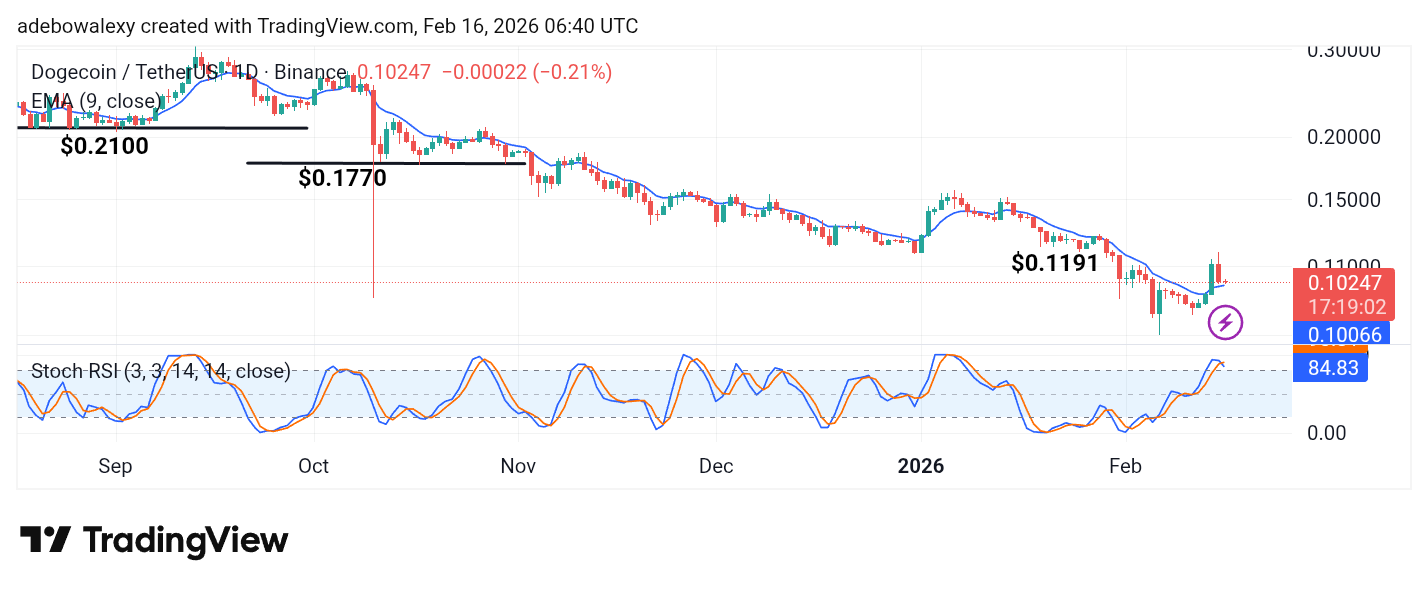
The last two price candles on the chart are bearish. While the bearish momentum was stronger in the previous session, the ongoing session has only provided modest progress to that trend, considering the appearance of the corresponding price candle in the current session. Nevertheless, trading activity remains above the 9-day Exponential Moving Average (EMA). Meanwhile, the Stochastic Relative Strength Index (SRSI) lines are in the overbought zone and have delivered a downward crossover.
Dogecoin (DOGE) Price Prediction: DOGE/USDT May Edge Lower
With price activity leaning toward lower levels, the Dogecoin market continues to assume a more vulnerable stance. Although the last price candle here has a small appearance and suggests reduced bearish pressure, price activity on the token’s daily chart still stands above the 9-day EMA curve.
Contrary to this is the fact that the SRSI indicator lines have delivered a downward crossover from elevated levels. The ensuing lines of the indicator, as of the time of writing, now maintain a more sideways trajectory but may continue to decline if bearish sentiment strengthens, which could also result in steeper dips in price action.
Dogecoin (DOGE) Price Prediction: DOGE/USDT Bears Seem to Be Hitting the Brakes
By progressing to a smaller timeframe of 4 hours, one can see that price activity has descended below the 9-day EMA curve. However, bearish progress here appears somewhat restrained. Recent price candles can be seen to be relatively small, presenting the impression that bearish forces are losing momentum.
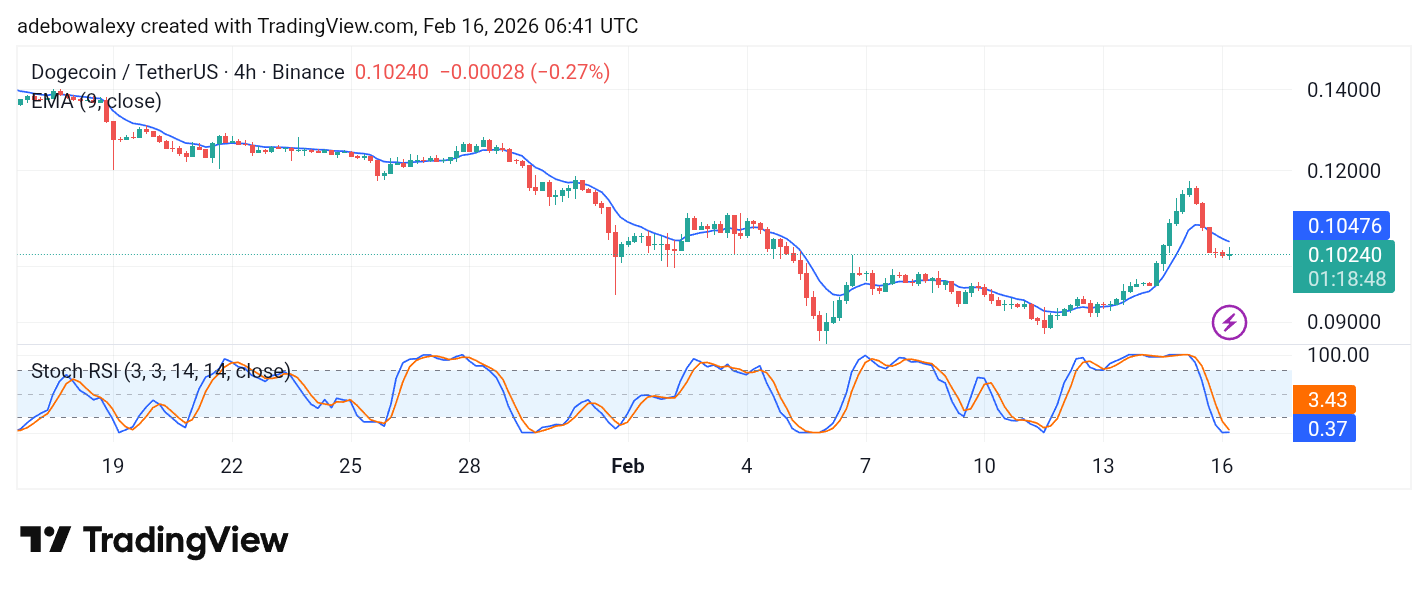
Meanwhile, the SRSI indicator lines have dropped to lower levels of the indicator. The terminals of the lines are now heading toward convergence. This aligns with the impression that bearish forces are slowing down, and the market may rebound toward the $0.1200 level once more.