Dogecoin Price Prediction: DOGE/USDT Bulls Struggling to Find Footing
Estimated Reading Time: 3 minutes
Don’t invest unless you’re prepared to lose all the money you invest. This is a high-risk investment and you are unlikely to be protected if something goes wrong. Take 2 minutes to learn more
Dogecoin Price Prediction (February 17):
Price action in the Dogecoin market appears to be experiencing reduced volatility. Nevertheless, price movement in this market remains above key technical levels, which may suggest a potential long-term downward correction.
DOGE/USDT Long-Term Trend: Bearish (Daily Chart)
Key Price Levels:
Resistance: $0.3000, $0.4000, $0.5000
Support: $0.2500, $0.2000, $0.3000
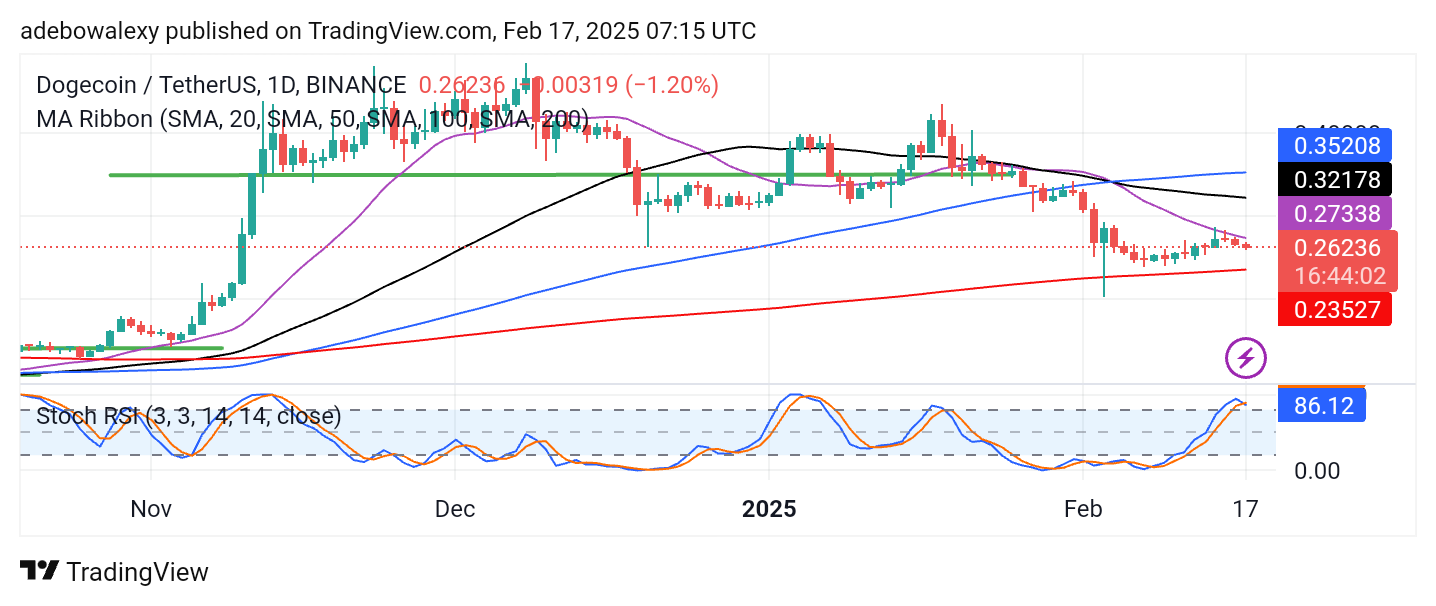
Price activity on this Dogecoin daily chart seems relatively calm above the $0.2500 threshold. Likewise, price action remains above the 200-day moving average (MA) lines. Meanwhile, the Stochastic Relative Strength Index (RSI) lines are in the overbought region and have just delivered a downward crossover. However, the lines of the indicator are now moving sideways.
Dogecoin Price Prediction: DOGE/USDT Market Forces Are Weak
The behavior of price action in the Dogecoin daily market suggests that market forces are losing momentum. More recently, price candles have been recoiling smoothly off the resistance formed by the 20-day MA lines. The market has moved downward but with reduced vigor. This indicates that market participants are exercising caution.
While this has impeded upside progress, it has also helped maintain support above key technical levels. The characteristics of the Stochastic RSI lines suggest that price action may lack the momentum to fall significantly despite the ongoing trend. Technically, this could allow price action to stay above critical support levels.
Dogecoin Price Prediction: DOGE/USDT Bears May Have Hit a Brick Wall (4-Hour Chart)
On the Dogecoin 4-hour chart, price action has landed just above the 50-day MA line. The corresponding price candle for the ongoing session is contracting upward, revealing a lower shadow. Additionally, the Stochastic RSI lines are currently flat in the oversold region.
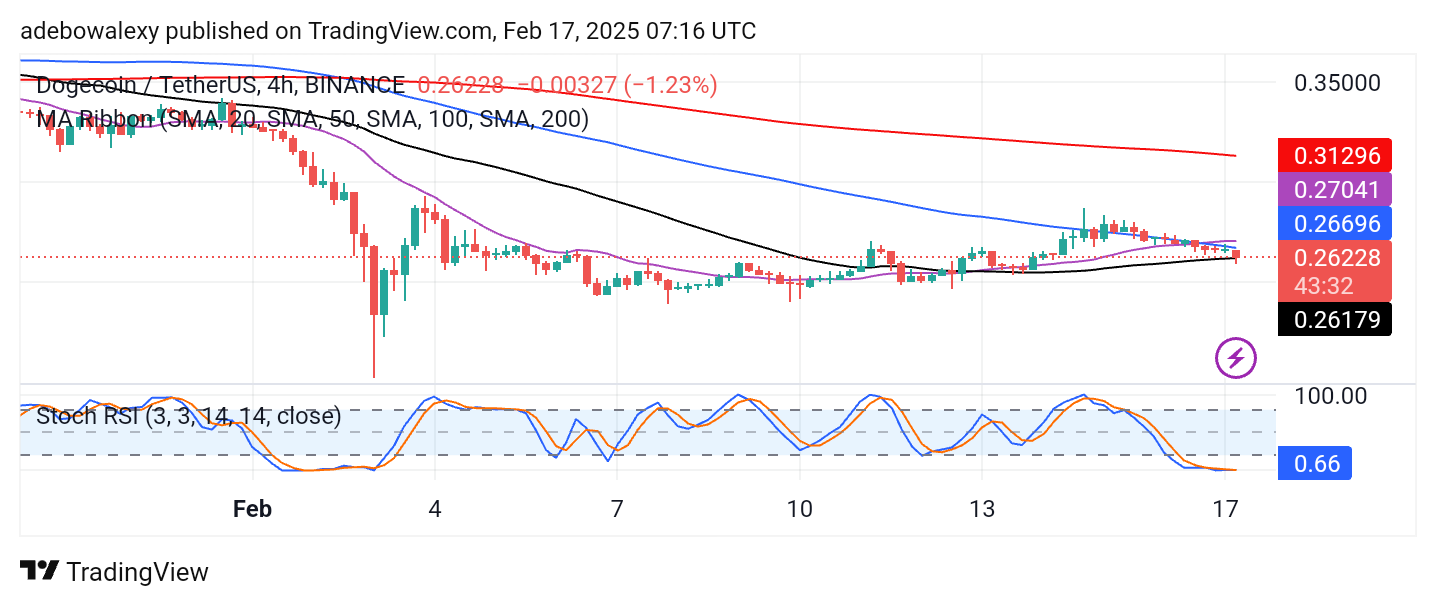
Technically, indications from this price chart suggest that price action may not move significantly downward. This is based on the fact that the RSI has already reached the depth of the oversold region. Furthermore, the last price candle is contracting upward, signaling that upward forces may be attempting to push the market higher. Consequently, even if the downward retracement continues, price action will likely remain above the $0.2500 price level.