Eigenlayer (EIGEN/USDT) Eyes Trend Reversal Amid Growing Volume
Estimated Reading Time: 3 minutes
Don’t invest unless you’re prepared to lose all the money you invest. This is a high-risk investment and you are unlikely to be protected if something goes wrong. Take 2 minutes to learn more

EigenLayer against the Tether has recently sparked attention after breaking out from a multi-week downtrend, driven by an uptick in buying volume and a bullish crossover on both the Guppy Multiple Moving Averages (GMMAs). However, with the price piercing through short-term resistance levels, bulls may prepare for a sustained upside push as overhead pressure remains with the market eyeing critical resistance zones.
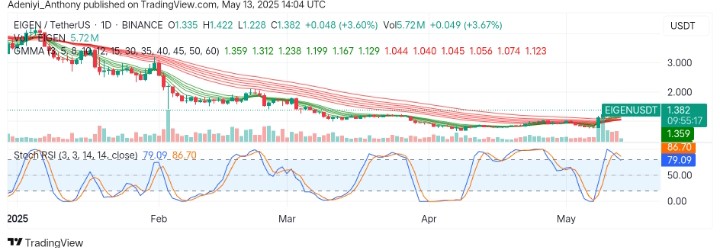
Recently, the pair’s price opened at $1.335, reaching $1.442 before descending to $1.382, realizing over 3% daily gain in the process. However, the volume at 5.72 million suggests more attention would be recorded in the near term as the volume bar improves.
Currently, EigenLayer trades at $1.382, showing signs of a bullish breakout despite the oscillator’s signal.
Technical Indicators
Major Resistance Levels: $1.4200, $1.7400, and $2.0000
Major Support Levels: $1.2300, $1.1100, and $0.9800
EigenLayer Technical Analysis
The analysis of the EigenLayer against the Tether shows that the pair is experiencing an upside swing from a downtrend. The GMMAs appear to be compressing as the indicator displays a potential sign of a trend change.
However, the Stochastic RSI, on the other hand, indicates a possibility of a short-term pullback with the lines operating between the 70 and 80 levels. To this end, with an improving volume, the pair could break above $1.4200 to $2.0000; otherwise, a range-bound activity might play out.
EIGEN/USDT Analysis: What’s Happening Here?
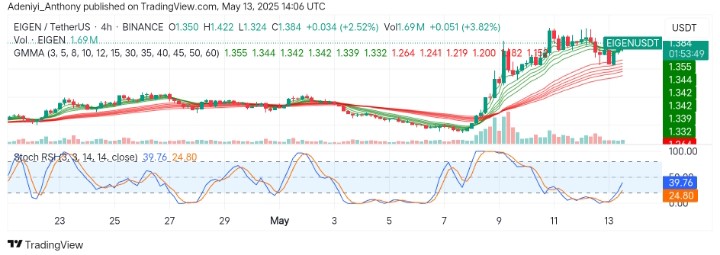
EIGEN/USDT on the 4H shows a strong bullish trend as seen in the way the price crosses above the GMMAs ribbon. However, in the short term, the pair aims for $1.6000, which may be followed by a minor correction before a further bounce to the north.
On the other hand, the Stochastic RSI shows a bullish crossover with the blue line sprouting towards the overbought region, suggesting a possible continuation of the uptrend. To this end, a move above $1.4200 would shift the trend bullishly.
You can purchase crypto coins here. Buy LBlock