Eigenlayer (EIGEN/USDT) Consolidates After Prolonged Downtrend
Estimated Reading Time: 3 minutes
Don’t invest unless you’re prepared to lose all the money you invest. This is a high-risk investment and you are unlikely to be protected if something goes wrong. Take 2 minutes to learn more

After months of sustained bearish pressure, the Eigenlayer against the Tether has entered a range-bound phase, suggesting a potential accumulation at the current $0.9500 range. However, indicators on the chart suggest sellers still dominate despite flattened Guppy Multiple Moving Averages (GMMAs) and expectations of a trend reversal.
Recently, the price action shows the pair is struggling to break above its stacked short-term GMMAs resistance zones. Moreover, the oscillator beneath the chart indicates prices might move to the south for a while before a noticeable change in trend.
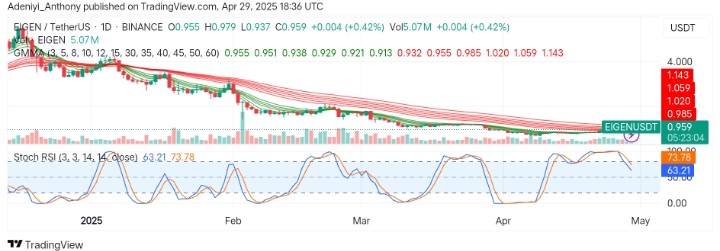
Currently, Eigenlayer trades at $0.959, recording 5.07 million traded volumes for the day.
Technical Indicators
Major Resistance Levels: $0.985, $1.020, and $1.143
Major Support Levels: $0.932, $0.913, and $0.885
EigenLayer Technical Analysis
On the daily timeframe, EigenLayer against the Tether is at a critical decision point, with the price currently compressing below the $0.985 resistance. However, the GMMAs signal a transition phase as the EMAs converge for a crossover.
From another angle, the Stochastic RSI suggests the price is heading south as the blue line leads the way. This indicates the pair’s value might devaluate before any upside movement is recorded.
To this end, failure to hold above $0.913 would signal a continued downtrend; otherwise, a break above $0.985 with stronger volume would signal the start of a transition to an uptrend.
EIGEN/USDT Analysis: What’s Next?
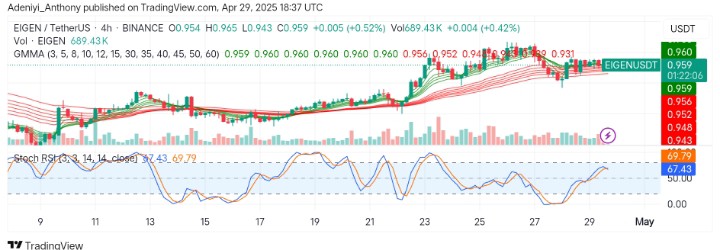
On the 4H chart, EIGEN/USDT appears to be struggling to sustain a bullish outlook as the price is positioned above the short-period EMAs, signaling strong short-term trend support. Moreover, the compression of the GMMAs ribbon suggests a healthy short-term uptrend continuation setup with the indicator still maintaining its bullish outlook despite recent struggles between the bulls and bears.
However, the oscillator remains elevated, reflecting bullish momentum but cautioning against a potential short-term overbought condition that can trigger a pullback. To this end, the pair would have to break above $0.960 for a continued trend or hold below $0.943 to chart a new course.
You can purchase crypto coins here. Buy LBlock